With savings rates plummeting, is the dollar still holding up? US Treasury bonds are poised for a dramatic shift this week.
2026-06-01 21:14:12
On Monday (June 1), US Treasury yields and the US dollar index diverged due to a combination of factors. The 2-year US Treasury yield was 4.028%, and the 10-year yield was 4.427%, both trading within the lower half of the Bollinger Bands. While the MACD histogram had turned positive, the momentum was weak, and the DIFF line remained below the zero line. The US dollar index continued its weakness, trading around 99.06, with a MACD histogram of -0.0169, indicating that bearish momentum had not yet dissipated. At the start of the week, the ongoing tensions surrounding Iran, the decline in the US personal savings rate to a four-year low, and Federal Reserve Chairman Warsh's comments on inflation measurement standards collectively formed the core context for market pricing.

The US Treasury market opened this week facing a reassessment of geopolitical risk premiums. Latest news indicates that after Iran shot down a US MQ-1 drone, the US military launched strikes against Iranian radar stations and drone command facilities near Qeshm Island and Hormuz province. Although negotiations between the US and Iran are ongoing, the continued military action suggests that Washington prefers to maintain maximum economic pressure on Iran while avoiding an escalation of the conflict to the point of triggering a sustained surge in oil prices. The transmission path of this "tightrope walking" strategy to US Treasury yields is clear: if further tensions disrupt shipping in the Strait of Hormuz, rising oil prices will push up inflation expectations, thereby suppressing US Treasury prices and pushing up yields.
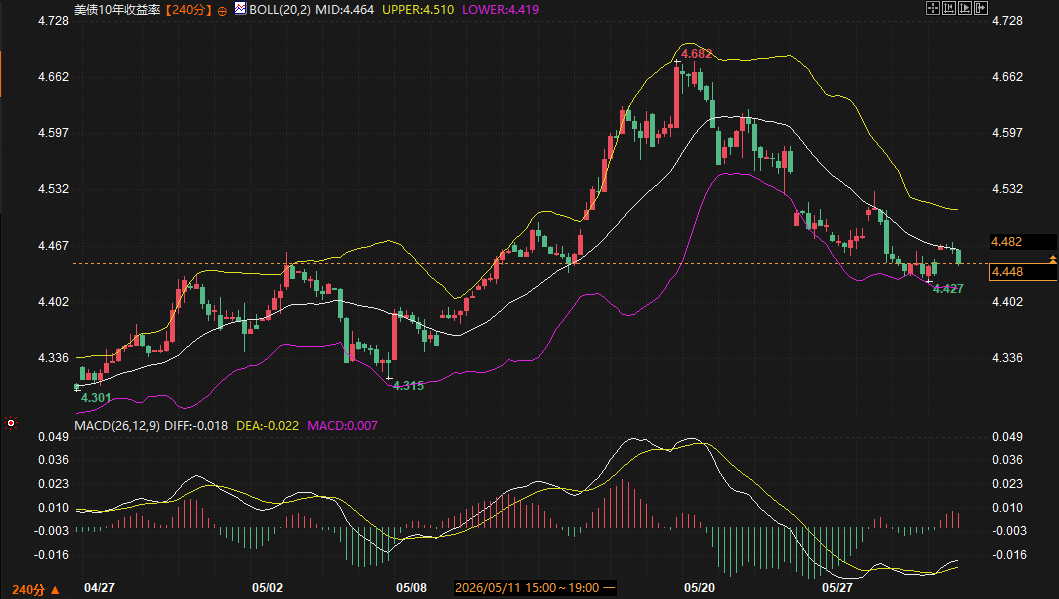
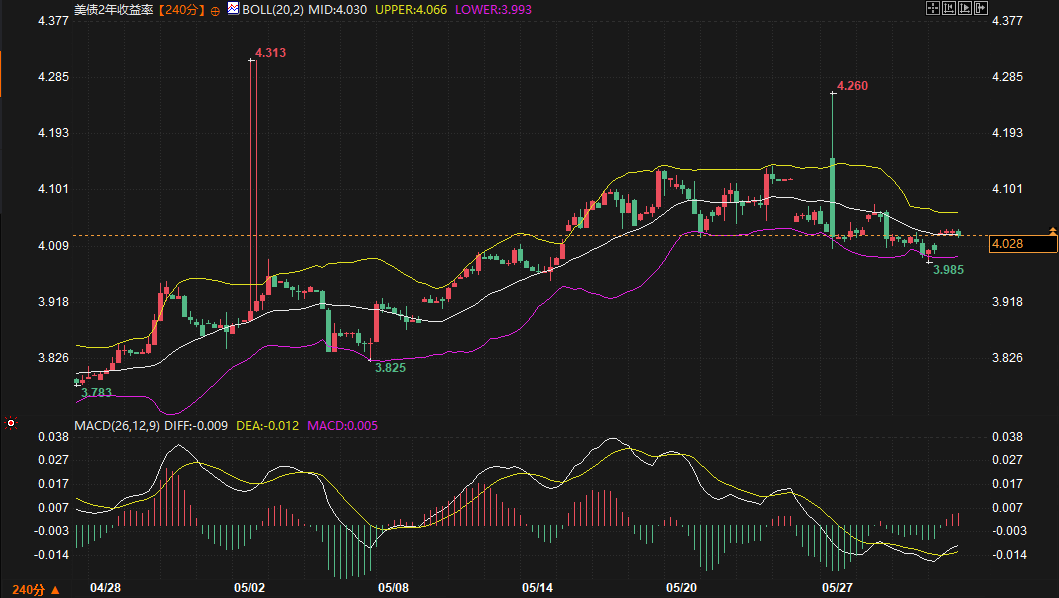
From a technical perspective, the 10-year US Treasury yield is currently at 4.427%, having fallen back to near the lower Bollinger Band at 4.419%, which forms a key short-term support level. If geopolitical news deteriorates, the yield may test the resistance zone of the middle Bollinger Band at 4.464% and even the upper Bollinger Band at 4.510%. For the 2-year yield, the price at 4.028% is also close to the lower Bollinger Band at 3.993%, with resistance at the middle Bollinger Band at 4.030% and the upper Bollinger Band at 4.066%. Major overseas institutions' tactical assessment of the 10-year yield is "two-way range trading, but with a greater inclination to sell on rallies," which largely aligns with current technical signals.
The most noteworthy signal from a fundamental perspective comes from the US household sector. The personal savings rate fell to 2.6% in April, the lowest level in four years, and more than halved from a year ago. Excluding the outlier in June 2022, this is the lowest savings rate reading since 2008. Meanwhile, inflation—driven by persistently rising energy prices—has outpaced wage growth for the first time in three years. This means that American households are depleting their savings at an unsustainable pace to maintain consumption. The proportion of auto loans overdue by more than 90 days rose to a record high of 5.6%, and the credit card delinquency rate rose to 13.1%, the highest since 2011, indicating that financial pressure on lower-income households is accumulating rapidly.
The long-term impact of this trend on the US dollar and US Treasury bonds cannot be ignored. As the largest pillar of the US economy, pressure on consumption will weaken market confidence in the Federal Reserve's continued tightening stance. Current SOFR futures pricing indicates the market has fully priced in a 25 basis point rate hike in December. However, if consumption data weakens subsequently, this rate hike pricing may face revision, thereby depressing short-term yields and putting downward pressure on the US dollar. It is worth noting that corporate profits as a percentage of GDP have risen to 18.4%, the second highest since the 1940s, further exacerbating the K-shaped divergence—the top 10% of income earners hold 90% of the nation's stock assets, and their consumption resilience masks the pressure on the bottom half of the population. As overseas analysts have stated, "Both profits and consumption face significant downside risks."
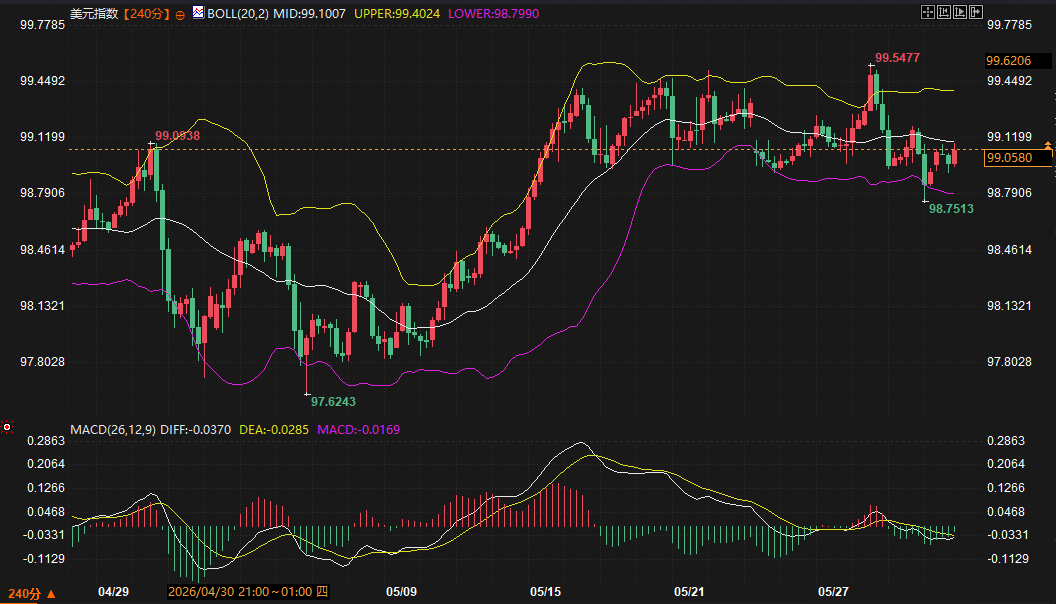
From a cross-market technical perspective, the US dollar index and US Treasury yields are currently showing some divergence. On the 240-minute chart of the US dollar index, the price has fallen from its mid-May high of 99.55 to its latest level of 99.06, breaking below the Bollinger Band middle line at 99.10. The MACD histogram is -0.0169, with both the DIFF and DEA lines below the zero line and showing a bearish divergence, indicating the downtrend has not yet reversed. Support levels to watch are the lower Bollinger Band at 98.80 and the previous pullback low of 98.75; if these levels are breached, the next support level to watch is the recent low of 97.62.
In contrast, technical signals for US Treasury yields have stabilized somewhat. Both the 2-year and 10-year MACD histograms have turned positive, and although the DIFF line remains below the zero line, the positive histogram suggests a weakening of short-term bearish momentum. However, whether this "weak stabilization" can evolve into a trend-driven rebound depends on the economic data to be released this week—especially the ISM Manufacturing PMI. The market expects the index to rise slightly to 53.0. If the actual reading exceeds expectations, it could strengthen expectations of an interest rate hike and push yields above the Bollinger Band's middle band; conversely, if the data weakens, yields may retest the lower band support. Furthermore, Fed Chairman Warsh recently pushed for attention to the "cut-off mean" inflation indicator, which shows current inflation is below the Fed's preferred indicator. If this policy signal is digested by the market, it could weaken the urgency of an interest rate hike, putting downward pressure on short-term yields.
In the short term (over the next 2-3 days), US Treasury yields are likely to maintain a range-bound trading pattern. The 10-year yield is likely to fluctuate within the 4.419%-4.464% range. If the ISM data exceeds expectations or the situation in Iran escalates suddenly, it may briefly test the upper resistance level of 4.510%. For the 2-year yield, the main trading range is 3.993%-4.066%. The US dollar index faces greater downside risk, with 98.75-98.80 being a key short-term support level. If this level is breached, a move towards 97.62 for support cannot be ruled out.
In the medium term, the transmission chain between the persistently low savings rate and pressure on consumption warrants continued monitoring. If consumption data shows a substantial slowdown in the second half of the year, the market's pricing of the Fed's interest rate hike path will face reassessment. At that time, US Treasury yields may shift from their current range-bound trading to a downward trend, and the US dollar index will also come under pressure. However, it should be noted that if the situation in Iran unexpectedly eases, leading to a decline in oil prices, cooling inflation expectations could simultaneously depress yields, creating a dual downward driver of "safe-haven buying" and "declining inflation expectations." Overall, the market is currently in a sensitive window where bullish and bearish factors are intertwined, and a directional breakout requires a new catalyst.
1. Why have US Treasury yields recently fallen from their highs?
The yield on 10-year US Treasury bonds fell back after hitting a high of 4.682% in mid-May, mainly driven by two factors: First, although the situation in Iran remained tense, market concerns about the conflict spiraling out of control and causing oil prices to soar have eased; second, the US personal savings rate fell to a low of 2.6%, raising concerns about the outlook for consumption and weakening the upward pressure on yields from expectations of interest rate hikes.
2. What are the current technical signals for the US dollar index?
The US dollar index is showing a bearish pattern on the 240-minute chart. The price has broken below the Bollinger Band middle line at 99.10, the MACD histogram is negative, and the DIFF and DEA lines are below the zero line and diverging in a death cross. Short-term support is located near the lower Bollinger Band at 98.80. If this level is breached, the previous low of 97.62 will become a key support level.
3. What does the decline in the US personal savings rate mean for the market?
The savings rate fell to 2.6% in April, the lowest in four years. This means that American households are maintaining consumption by depleting their savings, a model that is unsustainable. Once the consumption engine stalls, the core pillar of US economic growth will be impacted, which will in turn affect the Federal Reserve's monetary policy path. If consumption data continues to weaken, market pricing in interest rate hikes may be revised, thereby depressing short-term US Treasury yields and putting pressure on the dollar.
4. How will the situation in Iran affect US Treasury bonds and the US dollar?
The situation in Iran is being transmitted through two pathways: first, the oil price pathway—if the conflict disrupts shipping in the Strait of Hormuz, a surge in oil prices would push up inflation expectations, suppressing US Treasury prices and increasing yields; second, the safe-haven pathway—escalating geopolitical risks could trigger safe-haven flows into US Treasuries, lowering yields. Currently, the US is attempting to strike a balance between "maximum pressure" and "avoiding a surge in oil prices," and market pricing is still assessing the relative strength of these two forces.
5. What key data points are worth noting this week?
The ISM Manufacturing PMI, released this Monday (June 1st), is the most important short-term variable. The market expects 53.0; a reading exceeding this expectation could strengthen expectations of an interest rate hike, pushing yields upward; a reading below this expectation could exacerbate market concerns about an economic slowdown, depressing yields. In addition, the bidding results for the Treasury's $89 billion 3-month and $77 billion 6-month Treasury bills will also reflect the market's pricing attitude towards short-term interest rates.
In-depth analysis
Iran situation: a short-term pressure on rising yields
The US Treasury market opened this week facing a reassessment of geopolitical risk premiums. Latest news indicates that after Iran shot down a US MQ-1 drone, the US military launched strikes against Iranian radar stations and drone command facilities near Qeshm Island and Hormuz province. Although negotiations between the US and Iran are ongoing, the continued military action suggests that Washington prefers to maintain maximum economic pressure on Iran while avoiding an escalation of the conflict to the point of triggering a sustained surge in oil prices. The transmission path of this "tightrope walking" strategy to US Treasury yields is clear: if further tensions disrupt shipping in the Strait of Hormuz, rising oil prices will push up inflation expectations, thereby suppressing US Treasury prices and pushing up yields.
From a technical perspective, the 10-year US Treasury yield is currently at 4.427%, having fallen back to near the lower Bollinger Band at 4.419%, which forms a key short-term support level. If geopolitical news deteriorates, the yield may test the resistance zone of the middle Bollinger Band at 4.464% and even the upper Bollinger Band at 4.510%. For the 2-year yield, the price at 4.028% is also close to the lower Bollinger Band at 3.993%, with resistance at the middle Bollinger Band at 4.030% and the upper Bollinger Band at 4.066%. Major overseas institutions' tactical assessment of the 10-year yield is "two-way range trading, but with a greater inclination to sell on rallies," which largely aligns with current technical signals.
The collapse of the savings rate: a long-term concern for the consumption engine.
The most noteworthy signal from a fundamental perspective comes from the US household sector. The personal savings rate fell to 2.6% in April, the lowest level in four years, and more than halved from a year ago. Excluding the outlier in June 2022, this is the lowest savings rate reading since 2008. Meanwhile, inflation—driven by persistently rising energy prices—has outpaced wage growth for the first time in three years. This means that American households are depleting their savings at an unsustainable pace to maintain consumption. The proportion of auto loans overdue by more than 90 days rose to a record high of 5.6%, and the credit card delinquency rate rose to 13.1%, the highest since 2011, indicating that financial pressure on lower-income households is accumulating rapidly.
The long-term impact of this trend on the US dollar and US Treasury bonds cannot be ignored. As the largest pillar of the US economy, pressure on consumption will weaken market confidence in the Federal Reserve's continued tightening stance. Current SOFR futures pricing indicates the market has fully priced in a 25 basis point rate hike in December. However, if consumption data weakens subsequently, this rate hike pricing may face revision, thereby depressing short-term yields and putting downward pressure on the US dollar. It is worth noting that corporate profits as a percentage of GDP have risen to 18.4%, the second highest since the 1940s, further exacerbating the K-shaped divergence—the top 10% of income earners hold 90% of the nation's stock assets, and their consumption resilience masks the pressure on the bottom half of the population. As overseas analysts have stated, "Both profits and consumption face significant downside risks."
Technical divergence: Weak dollar, US Treasury yields await direction
From a cross-market technical perspective, the US dollar index and US Treasury yields are currently showing some divergence. On the 240-minute chart of the US dollar index, the price has fallen from its mid-May high of 99.55 to its latest level of 99.06, breaking below the Bollinger Band middle line at 99.10. The MACD histogram is -0.0169, with both the DIFF and DEA lines below the zero line and showing a bearish divergence, indicating the downtrend has not yet reversed. Support levels to watch are the lower Bollinger Band at 98.80 and the previous pullback low of 98.75; if these levels are breached, the next support level to watch is the recent low of 97.62.
In contrast, technical signals for US Treasury yields have stabilized somewhat. Both the 2-year and 10-year MACD histograms have turned positive, and although the DIFF line remains below the zero line, the positive histogram suggests a weakening of short-term bearish momentum. However, whether this "weak stabilization" can evolve into a trend-driven rebound depends on the economic data to be released this week—especially the ISM Manufacturing PMI. The market expects the index to rise slightly to 53.0. If the actual reading exceeds expectations, it could strengthen expectations of an interest rate hike and push yields above the Bollinger Band's middle band; conversely, if the data weakens, yields may retest the lower band support. Furthermore, Fed Chairman Warsh recently pushed for attention to the "cut-off mean" inflation indicator, which shows current inflation is below the Fed's preferred indicator. If this policy signal is digested by the market, it could weaken the urgency of an interest rate hike, putting downward pressure on short-term yields.
Trend Outlook
In the short term (over the next 2-3 days), US Treasury yields are likely to maintain a range-bound trading pattern. The 10-year yield is likely to fluctuate within the 4.419%-4.464% range. If the ISM data exceeds expectations or the situation in Iran escalates suddenly, it may briefly test the upper resistance level of 4.510%. For the 2-year yield, the main trading range is 3.993%-4.066%. The US dollar index faces greater downside risk, with 98.75-98.80 being a key short-term support level. If this level is breached, a move towards 97.62 for support cannot be ruled out.
In the medium term, the transmission chain between the persistently low savings rate and pressure on consumption warrants continued monitoring. If consumption data shows a substantial slowdown in the second half of the year, the market's pricing of the Fed's interest rate hike path will face reassessment. At that time, US Treasury yields may shift from their current range-bound trading to a downward trend, and the US dollar index will also come under pressure. However, it should be noted that if the situation in Iran unexpectedly eases, leading to a decline in oil prices, cooling inflation expectations could simultaneously depress yields, creating a dual downward driver of "safe-haven buying" and "declining inflation expectations." Overall, the market is currently in a sensitive window where bullish and bearish factors are intertwined, and a directional breakout requires a new catalyst.
Frequently Asked Questions
1. Why have US Treasury yields recently fallen from their highs?
The yield on 10-year US Treasury bonds fell back after hitting a high of 4.682% in mid-May, mainly driven by two factors: First, although the situation in Iran remained tense, market concerns about the conflict spiraling out of control and causing oil prices to soar have eased; second, the US personal savings rate fell to a low of 2.6%, raising concerns about the outlook for consumption and weakening the upward pressure on yields from expectations of interest rate hikes.
2. What are the current technical signals for the US dollar index?
The US dollar index is showing a bearish pattern on the 240-minute chart. The price has broken below the Bollinger Band middle line at 99.10, the MACD histogram is negative, and the DIFF and DEA lines are below the zero line and diverging in a death cross. Short-term support is located near the lower Bollinger Band at 98.80. If this level is breached, the previous low of 97.62 will become a key support level.
3. What does the decline in the US personal savings rate mean for the market?
The savings rate fell to 2.6% in April, the lowest in four years. This means that American households are maintaining consumption by depleting their savings, a model that is unsustainable. Once the consumption engine stalls, the core pillar of US economic growth will be impacted, which will in turn affect the Federal Reserve's monetary policy path. If consumption data continues to weaken, market pricing in interest rate hikes may be revised, thereby depressing short-term US Treasury yields and putting pressure on the dollar.
4. How will the situation in Iran affect US Treasury bonds and the US dollar?
The situation in Iran is being transmitted through two pathways: first, the oil price pathway—if the conflict disrupts shipping in the Strait of Hormuz, a surge in oil prices would push up inflation expectations, suppressing US Treasury prices and increasing yields; second, the safe-haven pathway—escalating geopolitical risks could trigger safe-haven flows into US Treasuries, lowering yields. Currently, the US is attempting to strike a balance between "maximum pressure" and "avoiding a surge in oil prices," and market pricing is still assessing the relative strength of these two forces.
5. What key data points are worth noting this week?
The ISM Manufacturing PMI, released this Monday (June 1st), is the most important short-term variable. The market expects 53.0; a reading exceeding this expectation could strengthen expectations of an interest rate hike, pushing yields upward; a reading below this expectation could exacerbate market concerns about an economic slowdown, depressing yields. In addition, the bidding results for the Treasury's $89 billion 3-month and $77 billion 6-month Treasury bills will also reflect the market's pricing attitude towards short-term interest rates.
- Risk Warning and Disclaimer
- The market involves risk, and trading may not be suitable for all investors. This article is for reference only and does not constitute personal investment advice, nor does it take into account certain users’ specific investment objectives, financial situation, or other needs. Any investment decisions made based on this information are at your own risk.