Will gold continue to fall in the short term? Or is 4400 the bottom? The logic has completely shifted.
2026-06-02 20:21:21
On Tuesday (June 2nd), spot gold fluctuated narrowly around 4500, clearly shifting to a lower volatility phase compared to the beginning of the year. Currently priced at 4528.76, it is trading below the Bollinger Band's middle line. The MACD histogram is slightly contracting, indicating weakening bearish momentum but a lack of bullish follow-through. Data from major overseas institutions shows that gold's status as a reserve asset continues to rise, with central bank holdings near historical peaks. However, the short-term market focus has shifted to inflation expectations and monetary policy pace driven by high oil prices, weakening the safe-haven logic. Overall, gold has shifted from event-driven volatility to a range-bound consolidation pattern influenced by both fundamentals and technical factors.

Reports from major overseas institutions show that by the end of 2025, gold accounted for 27% of global central bank reserves, officially replacing US Treasury bonds as the largest reserve asset. This shift stems from the combined effects of years of continuous gold purchases and rising gold prices. Global central banks hold a total of over 36,000 tons of gold, approaching historical highs. Data shows that in 2025, global central bank net gold purchases amounted to 850 tons, a slight slowdown from previous years, but China, Poland, Turkey, and India remained the main buyers. The logic suggests that, amid geopolitical tensions, the trend of central banks allocating gold as a highly liquid, non-dollar alternative asset remains unchanged, providing medium- to long-term support for gold prices. Even with short-term sentiment fluctuations, the strengthened reserve asset attribute limits the potential for a deep correction.
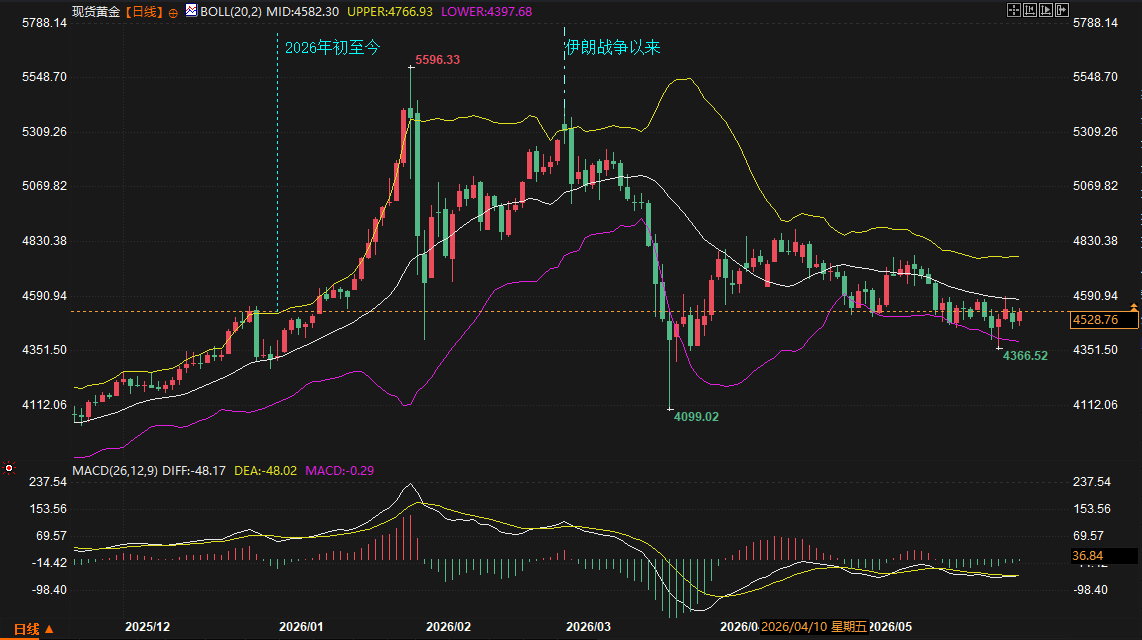
The initial surge in gold prices at the beginning of the year (from 4100 to 5596.33) was primarily driven by events and sentiment, with gains approaching 36%, and the MACD DIFF even reaching a historical high. Subsequently, the outbreak of the Iran-Iraq War caused the market to quickly shift from a safe-haven premium to a liquidity crunch in risk assets, resulting in a precipitous drop in prices to 4099.02, almost erasing all gains. This "buy the rumor, sell the fact" pattern clearly shows that the short-term impact of war on gold was mainly due to tightening liquidity. Currently, inflationary pressures triggered by soaring oil prices have become the new dominant factor, making it difficult for the Federal Reserve to quickly shift to easing, and gold's safe-haven attribute has temporarily given way to its anti-inflationary attribute. Data shows that the current price of 4528.76 is in a low-level consolidation range, and this shift in logic explains the core reason why the market has moved from the sharp fluctuations at the beginning of the year to "lingering around 4500".
From the daily chart in 2026, gold has entered a low-level consolidation phase after a double bottom. In terms of Bollinger Bands, the price is trading below the middle band at 4582.30, close to the lower band at 4397.68, with narrowing bandwidth indicating reduced volatility. The MACD indicator shows DIFF -48.17, DEA -48.02, and a green histogram value of -0.29, indicating that the bears are in control but momentum is clearly weakening, showing early signs of a bullish divergence. Key support levels are 4397-4400 (lower Bollinger Band), followed by 4366 and the absolute low of 4099; resistance levels are mainly at 4582 (middle band, a key level for bulls and bears), 4767 (upper band), and 4900 (previous rebound high). If the price stabilizes near 4400 with increased trading volume, a small double bottom may form; conversely, if it continues to be capped below 4582, a second test of the previous low is possible. The convergence of technical signals and fundamental support limits the probability of a one-sided downward move.
While central bank gold purchases have slowed temporarily, the overall trend remains stable. Turkey's significant reserve adjustments following the Iran war highlight the impact of geopolitical tensions on short-term supply. Dollar assets still dominate global reserves at 42%, but the increased proportion of gold reflects the ongoing de-dollarization process. Key risk factors include the subsequent developments in the Iranian situation (ceasefire or escalation), adjustments to the Federal Reserve's monetary policy path, and fluctuations in global risk aversion. These factors will directly influence the pace at which gold switches between its safe-haven and inflation-hedging attributes. The current low volatility is a result of the balance of multiple factors.
In the short term (1-2 weeks), gold is likely to remain range-bound with a slight downward bias between 4397 and 4582, awaiting a breakout signal from the Bollinger Band's middle line. In the medium term (1-3 months), the focus is on whether it can hold above 4582. Success would likely lead to a rebound to test the 4767-4900 range; continued pressure could result in a retest of the 4099 low, but support from central bank reserve assets is expected to provide strong buying. In the long term, with the consolidation of reserve asset status and evolving geopolitical factors, gold still has upward potential, but a clear shift in inflation or policy logic is needed. Overall, the market will likely consolidate within a range, digesting previous gains, with volatility expected to remain low until a new catalyst emerges.
How much higher can gold go?
Based on the historically high proportion of central bank reserve assets at 27% and a holding of 36,000 tons, there is room for upward movement in the medium to long term. However, in the short term, a breakout from the 4900-5596 range is needed to challenge new highs. Under the current logic, it is more likely that the market will first complete a period of consolidation before attempting a breakout, depending on the intensity of inflation expectations and the evolution of the geopolitical situation.
Will the market continue to trade sideways or break out in the short term?
Data shows that the Bollinger Bands are narrowing and the MACD momentum is weakening, suggesting that the price will likely continue to fluctuate sideways in the 4397-4582 range in the short term. A directional rebound is only possible if the price stabilizes effectively around 4400 with corresponding trading volume; overall, the market will likely remain in a consolidation phase.
When might the current low volatility logic change?
The key triggers are a substantial ceasefire or escalation in the Iranian situation, a clear statement from the Federal Reserve regarding the inflation path, or a significant resurgence of global risk aversion. When inflationary pressures caused by high oil prices ease, or when central banks accelerate their gold purchases again, the gold market's logic will shift from its current equilibrium to a new trend.
How will gold behave after the logic changes?
If the market shifts towards a stronger safe-haven logic, prices are expected to quickly test resistance above 4767; if inflationary pressures continue to suppress expectations of interest rate cuts, prices may remain weak and volatile at low levels; in extreme cases, a drop below 4099 would open up more downside potential, but the reserve asset attribute is expected to provide a buffer.
What indicators should investors focus on?
Key factors to watch include the Bollinger Band middle line at 4582, confirmation of MACD bullish divergence, updates to central bank gold purchase data, and developments in the Iranian situation. These factors collectively determine the price action and potential breakout direction within the support and resistance zones.
The shift in central bank reserve assets provides medium- to long-term support.
Reports from major overseas institutions show that by the end of 2025, gold accounted for 27% of global central bank reserves, officially replacing US Treasury bonds as the largest reserve asset. This shift stems from the combined effects of years of continuous gold purchases and rising gold prices. Global central banks hold a total of over 36,000 tons of gold, approaching historical highs. Data shows that in 2025, global central bank net gold purchases amounted to 850 tons, a slight slowdown from previous years, but China, Poland, Turkey, and India remained the main buyers. The logic suggests that, amid geopolitical tensions, the trend of central banks allocating gold as a highly liquid, non-dollar alternative asset remains unchanged, providing medium- to long-term support for gold prices. Even with short-term sentiment fluctuations, the strengthened reserve asset attribute limits the potential for a deep correction.
The US-Iran situation is driving a shift in logic: risk aversion is being transmitted to inflation.
The initial surge in gold prices at the beginning of the year (from 4100 to 5596.33) was primarily driven by events and sentiment, with gains approaching 36%, and the MACD DIFF even reaching a historical high. Subsequently, the outbreak of the Iran-Iraq War caused the market to quickly shift from a safe-haven premium to a liquidity crunch in risk assets, resulting in a precipitous drop in prices to 4099.02, almost erasing all gains. This "buy the rumor, sell the fact" pattern clearly shows that the short-term impact of war on gold was mainly due to tightening liquidity. Currently, inflationary pressures triggered by soaring oil prices have become the new dominant factor, making it difficult for the Federal Reserve to quickly shift to easing, and gold's safe-haven attribute has temporarily given way to its anti-inflationary attribute. Data shows that the current price of 4528.76 is in a low-level consolidation range, and this shift in logic explains the core reason why the market has moved from the sharp fluctuations at the beginning of the year to "lingering around 4500".
Technical range characteristics and key price levels
From the daily chart in 2026, gold has entered a low-level consolidation phase after a double bottom. In terms of Bollinger Bands, the price is trading below the middle band at 4582.30, close to the lower band at 4397.68, with narrowing bandwidth indicating reduced volatility. The MACD indicator shows DIFF -48.17, DEA -48.02, and a green histogram value of -0.29, indicating that the bears are in control but momentum is clearly weakening, showing early signs of a bullish divergence. Key support levels are 4397-4400 (lower Bollinger Band), followed by 4366 and the absolute low of 4099; resistance levels are mainly at 4582 (middle band, a key level for bulls and bears), 4767 (upper band), and 4900 (previous rebound high). If the price stabilizes near 4400 with increased trading volume, a small double bottom may form; conversely, if it continues to be capped below 4582, a second test of the previous low is possible. The convergence of technical signals and fundamental support limits the probability of a one-sided downward move.
Supply and demand dynamics intertwined with risk factors
While central bank gold purchases have slowed temporarily, the overall trend remains stable. Turkey's significant reserve adjustments following the Iran war highlight the impact of geopolitical tensions on short-term supply. Dollar assets still dominate global reserves at 42%, but the increased proportion of gold reflects the ongoing de-dollarization process. Key risk factors include the subsequent developments in the Iranian situation (ceasefire or escalation), adjustments to the Federal Reserve's monetary policy path, and fluctuations in global risk aversion. These factors will directly influence the pace at which gold switches between its safe-haven and inflation-hedging attributes. The current low volatility is a result of the balance of multiple factors.
Trend Outlook
In the short term (1-2 weeks), gold is likely to remain range-bound with a slight downward bias between 4397 and 4582, awaiting a breakout signal from the Bollinger Band's middle line. In the medium term (1-3 months), the focus is on whether it can hold above 4582. Success would likely lead to a rebound to test the 4767-4900 range; continued pressure could result in a retest of the 4099 low, but support from central bank reserve assets is expected to provide strong buying. In the long term, with the consolidation of reserve asset status and evolving geopolitical factors, gold still has upward potential, but a clear shift in inflation or policy logic is needed. Overall, the market will likely consolidate within a range, digesting previous gains, with volatility expected to remain low until a new catalyst emerges.
Frequently Asked Questions
How much higher can gold go?
Based on the historically high proportion of central bank reserve assets at 27% and a holding of 36,000 tons, there is room for upward movement in the medium to long term. However, in the short term, a breakout from the 4900-5596 range is needed to challenge new highs. Under the current logic, it is more likely that the market will first complete a period of consolidation before attempting a breakout, depending on the intensity of inflation expectations and the evolution of the geopolitical situation.
Will the market continue to trade sideways or break out in the short term?
Data shows that the Bollinger Bands are narrowing and the MACD momentum is weakening, suggesting that the price will likely continue to fluctuate sideways in the 4397-4582 range in the short term. A directional rebound is only possible if the price stabilizes effectively around 4400 with corresponding trading volume; overall, the market will likely remain in a consolidation phase.
When might the current low volatility logic change?
The key triggers are a substantial ceasefire or escalation in the Iranian situation, a clear statement from the Federal Reserve regarding the inflation path, or a significant resurgence of global risk aversion. When inflationary pressures caused by high oil prices ease, or when central banks accelerate their gold purchases again, the gold market's logic will shift from its current equilibrium to a new trend.
How will gold behave after the logic changes?
If the market shifts towards a stronger safe-haven logic, prices are expected to quickly test resistance above 4767; if inflationary pressures continue to suppress expectations of interest rate cuts, prices may remain weak and volatile at low levels; in extreme cases, a drop below 4099 would open up more downside potential, but the reserve asset attribute is expected to provide a buffer.
What indicators should investors focus on?
Key factors to watch include the Bollinger Band middle line at 4582, confirmation of MACD bullish divergence, updates to central bank gold purchase data, and developments in the Iranian situation. These factors collectively determine the price action and potential breakout direction within the support and resistance zones.
- Risk Warning and Disclaimer
- The market involves risk, and trading may not be suitable for all investors. This article is for reference only and does not constitute personal investment advice, nor does it take into account certain users’ specific investment objectives, financial situation, or other needs. Any investment decisions made based on this information are at your own risk.