Technical analysis of the 10-year US Treasury yield: Continued pressure in the short term; focus on key support levels.
2026-06-02 20:01:02
US Treasury yields have recently come under pressure and fallen, fueling market expectations for a Federal Reserve rate cut, a view reinforced by some weaker economic data. However, inflation remains sticky, fundamental disagreements persist, and technical analysis may provide more direct directional guidance.

Weekly chart: The trendline break below the previous level is a warning sign, but the moving averages still indicate a bullish trend.
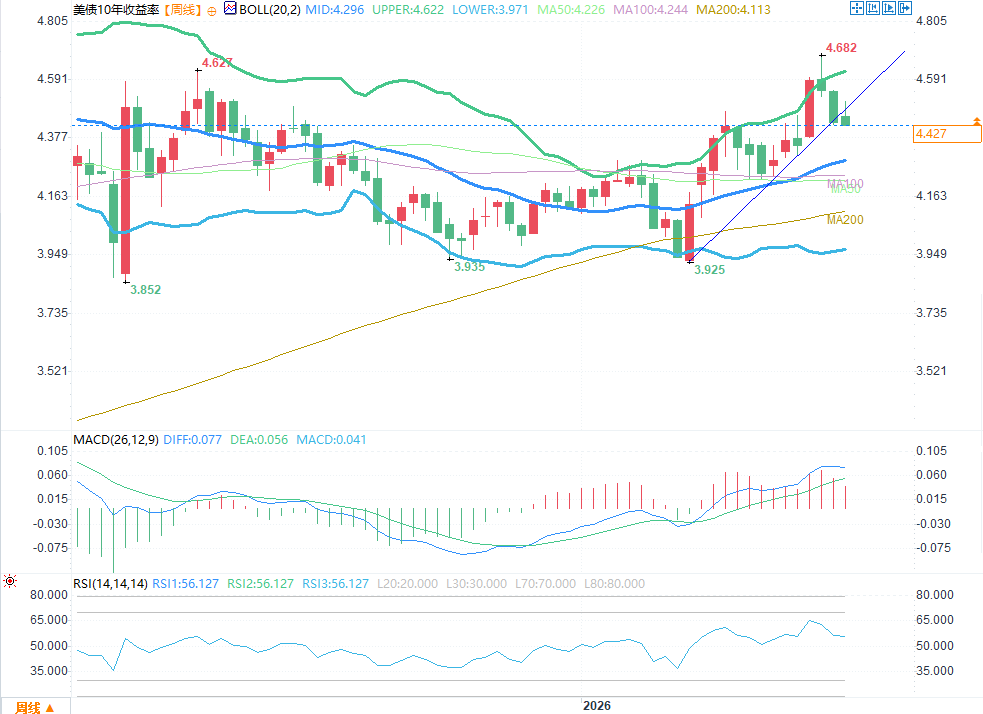
This week's candlestick chart currently shows an upper shadow, indicating that the bulls encountered resistance after pushing higher, resulting in a significant pullback at the close, suggesting that selling pressure from above should not be underestimated. More importantly, this week's yield has broken below a key upward trend line, a technical warning signal of a potential mid-term correction.
However, while the moving average system currently maintains a bullish alignment, the 50-day, 100-day, and 200-day moving averages (MA50, MA100, and MA200) have shown signs of flattening or even slightly turning downwards, indicating a slowing of the bullish slope and a weakening of medium-term upward momentum. Therefore, the weekly chart shows a divergence between bulls and bears: a break below the trendline is a bearish signal, and although the moving averages are still providing support below the price, the flattening slope suggests that the support is not as strong as before. The key focus going forward is whether the price can recover above the trendline before the close this week. If not, the medium-term downward pressure will be further transmitted downwards.
Daily chart: The bearish trend continues, and the decline has not yet stabilized.
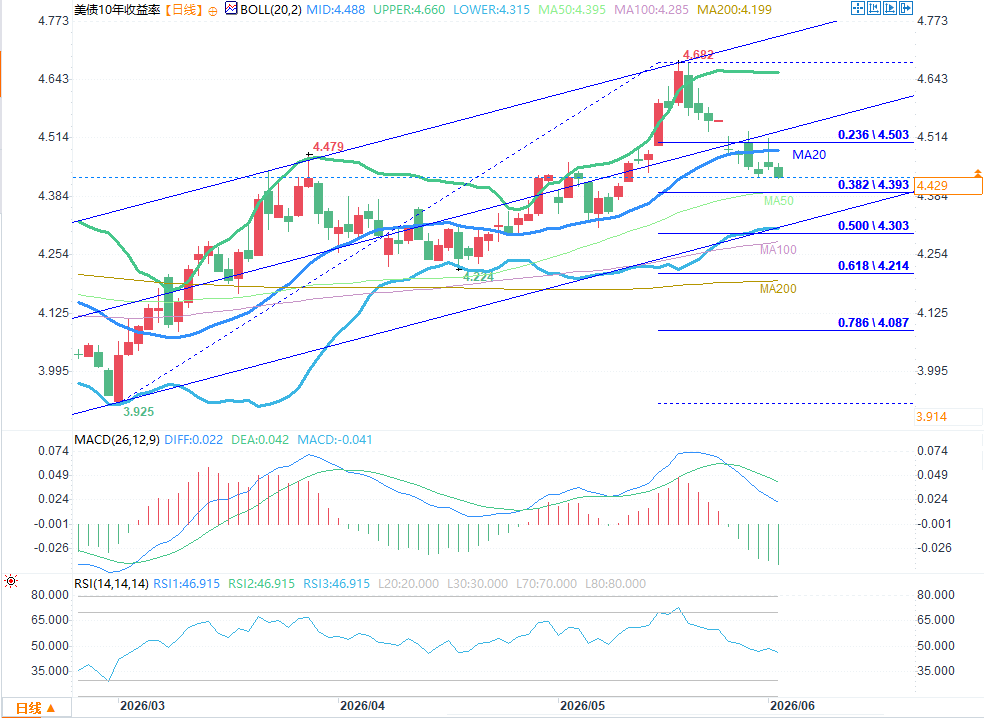
The trend is weak, and the middle band has been breached.
On the daily chart, the yield has been trading below the middle Bollinger Band of the upward trend line for several consecutive days. The middle band has turned from support to resistance, and the bears have gained temporary dominance.
Five consecutive days of decline with long upper shadows indicate heavy resistance from above.
Yields have fallen for five consecutive trading days, with many of the candlesticks showing long upper shadows. Every attempt by the bulls to rebound has been suppressed by the bears, with buying power unable to sustain and selling pressure remaining.
Key support: The 0.382 level and the MA50 convergence zone (4.393).
The current price is testing the high convergence zone of the 0.382 Fibonacci retracement level (4.393) and the 50-day moving average (4.395), which is the most critical support/resistance level in the near term. If this support holds, it could trigger a short-term rebound; if this level is breached, the next target will be the 0.5 Fibonacci retracement level at 4.303, and the correction will likely widen further.
The strong resistance above limits the upside potential.
The MA20, the Bollinger Band middle line, and the 0.236 retracement level (4.503) are all very close to each other, forming a dense resistance zone. Even if a rebound occurs, the upside potential will be very limited.
Conclusion: The daily chart shows a bearish trend with no signs of a bottoming out, and yields may continue to decline in the coming days.
4-hour chart: Death cross confirmed, but oversold rebound window opens.
The moving averages have formed a death cross, indicating a downward trend in the short to medium term.
The moving average system on the 4-hour chart has formed a death cross, and the price is trading below all the moving averages, which confirms the bearish outlook on the daily chart.
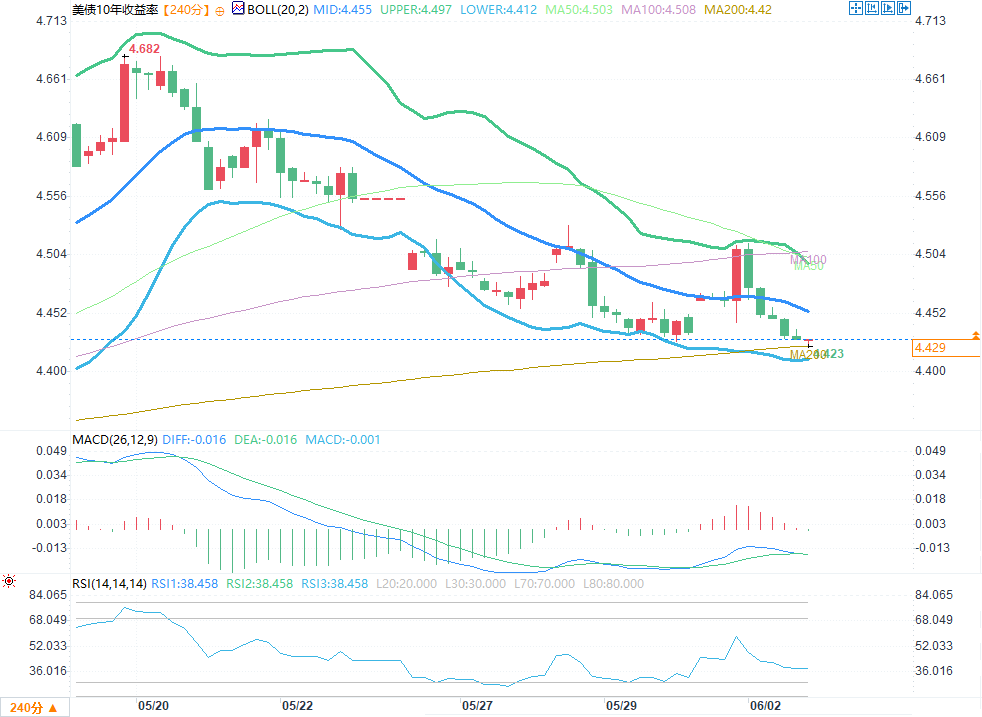
The RSI is approaching oversold levels and supported by the 200-day moving average, suggesting a short-term rebound is likely.
However, some noteworthy short-term signals have emerged: the 4-hour RSI has fallen back to around 38, approaching oversold territory, indicating that short-term selling pressure is weakening; simultaneously, the current price is approaching the 4-hour MA200 (4.423), with the long-term moving average providing natural support. Given these combined factors, the possibility of a short-term technical oversold rebound is increasing. However, the daily trend remains bearish, and this rebound is likely a corrective move within a downtrend rather than a trend reversal, with its potential upside limited by strong resistance on the daily chart.
in conclusion
The weekly trendline break below the previous low is a warning sign, and the daily chart suggests a high probability of a continued downtrend. The 4-hour chart shows oversold conditions combined with support from the 200-period moving average (MA200), presenting a short-term rebound opportunity. The 0.382/MA50 confluence zone (4.393) is the key battleground in the near term; holding above this level will lead to a rebound, while a break below it will result in further declines. Once the direction is clear, following the trend is the most prudent approach at present.
Weekly chart: The trendline break below the previous level is a warning sign, but the moving averages still indicate a bullish trend.
This week's candlestick chart currently shows an upper shadow, indicating that the bulls encountered resistance after pushing higher, resulting in a significant pullback at the close, suggesting that selling pressure from above should not be underestimated. More importantly, this week's yield has broken below a key upward trend line, a technical warning signal of a potential mid-term correction.
However, while the moving average system currently maintains a bullish alignment, the 50-day, 100-day, and 200-day moving averages (MA50, MA100, and MA200) have shown signs of flattening or even slightly turning downwards, indicating a slowing of the bullish slope and a weakening of medium-term upward momentum. Therefore, the weekly chart shows a divergence between bulls and bears: a break below the trendline is a bearish signal, and although the moving averages are still providing support below the price, the flattening slope suggests that the support is not as strong as before. The key focus going forward is whether the price can recover above the trendline before the close this week. If not, the medium-term downward pressure will be further transmitted downwards.
Daily chart: The bearish trend continues, and the decline has not yet stabilized.
The trend is weak, and the middle band has been breached.
On the daily chart, the yield has been trading below the middle Bollinger Band of the upward trend line for several consecutive days. The middle band has turned from support to resistance, and the bears have gained temporary dominance.
Five consecutive days of decline with long upper shadows indicate heavy resistance from above.
Yields have fallen for five consecutive trading days, with many of the candlesticks showing long upper shadows. Every attempt by the bulls to rebound has been suppressed by the bears, with buying power unable to sustain and selling pressure remaining.
Key support: The 0.382 level and the MA50 convergence zone (4.393).
The current price is testing the high convergence zone of the 0.382 Fibonacci retracement level (4.393) and the 50-day moving average (4.395), which is the most critical support/resistance level in the near term. If this support holds, it could trigger a short-term rebound; if this level is breached, the next target will be the 0.5 Fibonacci retracement level at 4.303, and the correction will likely widen further.
The strong resistance above limits the upside potential.
The MA20, the Bollinger Band middle line, and the 0.236 retracement level (4.503) are all very close to each other, forming a dense resistance zone. Even if a rebound occurs, the upside potential will be very limited.
Conclusion: The daily chart shows a bearish trend with no signs of a bottoming out, and yields may continue to decline in the coming days.
4-hour chart: Death cross confirmed, but oversold rebound window opens.
The moving averages have formed a death cross, indicating a downward trend in the short to medium term.
The moving average system on the 4-hour chart has formed a death cross, and the price is trading below all the moving averages, which confirms the bearish outlook on the daily chart.
The RSI is approaching oversold levels and supported by the 200-day moving average, suggesting a short-term rebound is likely.
However, some noteworthy short-term signals have emerged: the 4-hour RSI has fallen back to around 38, approaching oversold territory, indicating that short-term selling pressure is weakening; simultaneously, the current price is approaching the 4-hour MA200 (4.423), with the long-term moving average providing natural support. Given these combined factors, the possibility of a short-term technical oversold rebound is increasing. However, the daily trend remains bearish, and this rebound is likely a corrective move within a downtrend rather than a trend reversal, with its potential upside limited by strong resistance on the daily chart.
in conclusion
The weekly trendline break below the previous low is a warning sign, and the daily chart suggests a high probability of a continued downtrend. The 4-hour chart shows oversold conditions combined with support from the 200-period moving average (MA200), presenting a short-term rebound opportunity. The 0.382/MA50 confluence zone (4.393) is the key battleground in the near term; holding above this level will lead to a rebound, while a break below it will result in further declines. Once the direction is clear, following the trend is the most prudent approach at present.
- Risk Warning and Disclaimer
- The market involves risk, and trading may not be suitable for all investors. This article is for reference only and does not constitute personal investment advice, nor does it take into account certain users’ specific investment objectives, financial situation, or other needs. Any investment decisions made based on this information are at your own risk.