The gold-silver ratio continued to widen, with silver hitting a two-and-a-half-month low.
2026-06-10 11:57:54
On Wednesday (June 10) during the Asian session, the precious metals market continued to be under pressure, with spot gold falling nearly 1.8% to around $4,180 per ounce, while spot silver fell 2% to around $64 per ounce.
This performance disparity has widened the gold-silver ratio to approximately 65.44, exceeding the upper limit of the 55-62 trading range of the past six weeks. The gold-silver ratio breaking through the upper limit indicates that silver is significantly undervalued relative to gold, and from a historical regression perspective, there is a theoretical basis for silver to catch up. However, silver is currently facing downward pressure in tandem with gold.
While industrial demand provides some long-term support for silver, the strength of the US dollar and expectations of Fed rate hikes pose a stronger downward pressure in the short term, making it difficult for silver to strengthen independently.
The gold-silver ratio is currently around 65.44, widening further from 59 two trading days ago. This ratio had been fluctuating between 55 and 62 for the past six weeks, and has now clearly broken through the upper limit of that range, indicating that silver is being further sold off relative to gold, rather than breaking away from gold's downward trend.
Historical experience shows that a significant widening of the gold-silver ratio above 65 typically occurs during periods of systemic selling in silver or when gold exhibits relative resilience. The core question facing the market is: will this divergence continue to widen, or will it lead to mean reversion?
Silver, as a metal with both monetary and industrial attributes, has seen its dual identity become increasingly prominent as the gold-silver ratio shrinks. While gold primarily reacts to real interest rates and the dollar's performance, silver is receiving support from industrial demand. The base metals sector has shown signs of stabilization, with copper prices holding steady above $4.20 per pound and palladium rebounding from recent lows.
The semiconductor industry is a key driver of silver demand in the electronics and photovoltaic sectors, and recent purchasing activity by Asian manufacturers, particularly in China, has improved. This has partially offset the adverse effects of a stronger dollar and rising opportunity costs of holding non-interest-bearing assets. The silver market is essentially pricing in a scenario where industrial demand provides a floor, while monetary demand remains constrained by central bank policy expectations.
The dynamics of the yield curve add another layer of complexity to the precious metals market. Currently, the 2-year US Treasury yield has risen to 4.14%, while the 10-year yield is anchored around 4.53%. It's worth noting that the current 2-year yield is lower than the 10-year yield, with a spread of approximately 0.39 percentage points. The yield curve is not inverted but exhibits a normal positive slope. This shape typically reflects market expectations of stable short-term interest rates, while the relatively high 10-year yield suggests a degree of optimism regarding long-term economic growth and inflation prospects.
Historically, gold's performance has often lacked clear patterns during periods when the yield curve maintains a positive slope but spreads are narrow. When the curve is in a normal shape, market concerns about recession are weaker, and gold's appeal as a safe-haven asset is relatively limited. In contrast, real interest rates and the dollar's performance have a more significant impact on gold pricing in the current environment.
However, the situation for silver depends more on marginal changes in industrial demand. Although silver also possesses precious metal attributes, its status as an industrial metal makes it far more sensitive to growth expectations than to narratives of pure currency devaluation. The current relatively high 10-year yield of 4.53% reflects that the market is not overly pessimistic about the economic outlook, which provides some support rather than downward pressure on industrial demand expectations for silver.
Spot silver has shown a clear downward trend recently on the daily chart, with prices falling rapidly from the previous high of 89.34 and currently trading around 64. It has broken below multiple short-term moving averages, indicating a weak short-term trend. The moving average system shows that after breaking below the MA20 and MA50 moving averages, the price is testing support near the previous low of 63.65.
In terms of indicators, the MACD DIFF line is running below the DEA line, and the green bars continue to expand, indicating that the bearish momentum is still being released; the RSI indicator has fallen back to around 31, approaching the oversold zone, and there may be a short-term technical rebound demand, but there has been no clear stabilization signal yet.
In summary, silver is currently in a short-term correction phase. The area around 74.68 represents a previous consolidation level and moving average resistance; any rebound to this area is likely to encounter resistance. Key support lies in the 63.60-61.00 range; a break below this level would open up further downside potential. The recommended trading strategy is to adopt a slightly bearish approach, focusing on the effectiveness of support levels and waiting for stabilization signals before considering buying on dips.
(Spot silver daily chart, source: EasyForex)
Scenario 1: Mean Reversion Bullish Scenario. If the gold-silver ratio falls from its current high and breaks below the 62 level, it indicates that silver is starting to catch up with gold's decline or that gold is experiencing a correction. Silver is expected to see a phase of rebound, targeting the $68-$70 resistance zone. In this scenario, gold needs to stabilize or rebound moderately to provide sentiment support for silver.
Scenario 2: Further Expanding the Bearish Scenario. If the gold-silver ratio widens further to above 68 or even 70, it will confirm that silver is still being systematically sold off by the market, with selling pressure stronger than that on gold. The support level around $63.60 will face a severe test. Catalysts for this scenario could be a further strengthening of the US dollar, a more hawkish signal from the Federal Reserve, or an unexpectedly severe deterioration in industrial demand data.
At 11:55 AM Beijing time on June 10, spot silver was trading at $64.04 per ounce.
This performance disparity has widened the gold-silver ratio to approximately 65.44, exceeding the upper limit of the 55-62 trading range of the past six weeks. The gold-silver ratio breaking through the upper limit indicates that silver is significantly undervalued relative to gold, and from a historical regression perspective, there is a theoretical basis for silver to catch up. However, silver is currently facing downward pressure in tandem with gold.
While industrial demand provides some long-term support for silver, the strength of the US dollar and expectations of Fed rate hikes pose a stronger downward pressure in the short term, making it difficult for silver to strengthen independently.
Gold-Silver Ratio: Approaching a Key Turning Point
The gold-silver ratio is currently around 65.44, widening further from 59 two trading days ago. This ratio had been fluctuating between 55 and 62 for the past six weeks, and has now clearly broken through the upper limit of that range, indicating that silver is being further sold off relative to gold, rather than breaking away from gold's downward trend.
Historical experience shows that a significant widening of the gold-silver ratio above 65 typically occurs during periods of systemic selling in silver or when gold exhibits relative resilience. The core question facing the market is: will this divergence continue to widen, or will it lead to mean reversion?
Industrial demand: providing unique support for silver
Silver, as a metal with both monetary and industrial attributes, has seen its dual identity become increasingly prominent as the gold-silver ratio shrinks. While gold primarily reacts to real interest rates and the dollar's performance, silver is receiving support from industrial demand. The base metals sector has shown signs of stabilization, with copper prices holding steady above $4.20 per pound and palladium rebounding from recent lows.
The semiconductor industry is a key driver of silver demand in the electronics and photovoltaic sectors, and recent purchasing activity by Asian manufacturers, particularly in China, has improved. This has partially offset the adverse effects of a stronger dollar and rising opportunity costs of holding non-interest-bearing assets. The silver market is essentially pricing in a scenario where industrial demand provides a floor, while monetary demand remains constrained by central bank policy expectations.
Yield Curve
The dynamics of the yield curve add another layer of complexity to the precious metals market. Currently, the 2-year US Treasury yield has risen to 4.14%, while the 10-year yield is anchored around 4.53%. It's worth noting that the current 2-year yield is lower than the 10-year yield, with a spread of approximately 0.39 percentage points. The yield curve is not inverted but exhibits a normal positive slope. This shape typically reflects market expectations of stable short-term interest rates, while the relatively high 10-year yield suggests a degree of optimism regarding long-term economic growth and inflation prospects.
Historically, gold's performance has often lacked clear patterns during periods when the yield curve maintains a positive slope but spreads are narrow. When the curve is in a normal shape, market concerns about recession are weaker, and gold's appeal as a safe-haven asset is relatively limited. In contrast, real interest rates and the dollar's performance have a more significant impact on gold pricing in the current environment.
However, the situation for silver depends more on marginal changes in industrial demand. Although silver also possesses precious metal attributes, its status as an industrial metal makes it far more sensitive to growth expectations than to narratives of pure currency devaluation. The current relatively high 10-year yield of 4.53% reflects that the market is not overly pessimistic about the economic outlook, which provides some support rather than downward pressure on industrial demand expectations for silver.
Technical Analysis of Silver
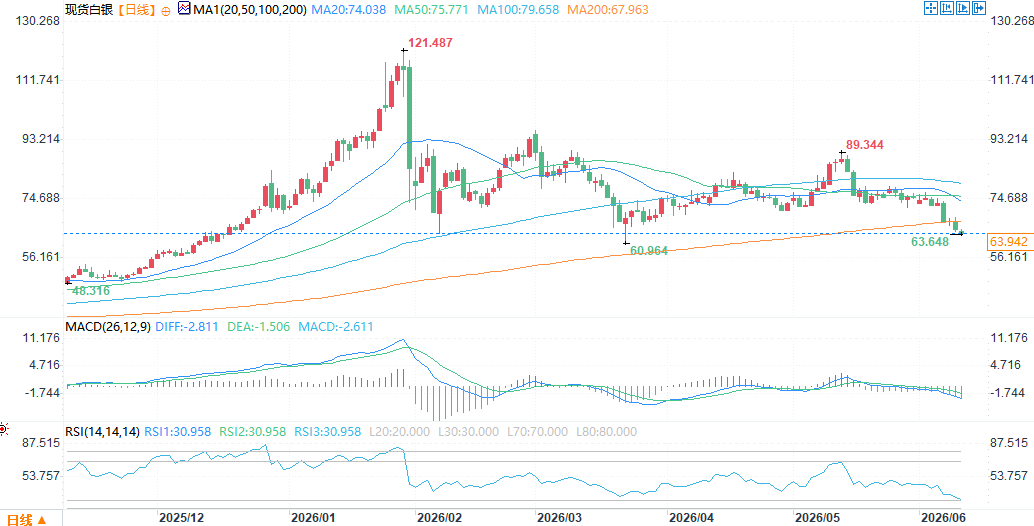
Spot silver has shown a clear downward trend recently on the daily chart, with prices falling rapidly from the previous high of 89.34 and currently trading around 64. It has broken below multiple short-term moving averages, indicating a weak short-term trend. The moving average system shows that after breaking below the MA20 and MA50 moving averages, the price is testing support near the previous low of 63.65.
In terms of indicators, the MACD DIFF line is running below the DEA line, and the green bars continue to expand, indicating that the bearish momentum is still being released; the RSI indicator has fallen back to around 31, approaching the oversold zone, and there may be a short-term technical rebound demand, but there has been no clear stabilization signal yet.
In summary, silver is currently in a short-term correction phase. The area around 74.68 represents a previous consolidation level and moving average resistance; any rebound to this area is likely to encounter resistance. Key support lies in the 63.60-61.00 range; a break below this level would open up further downside potential. The recommended trading strategy is to adopt a slightly bearish approach, focusing on the effectiveness of support levels and waiting for stabilization signals before considering buying on dips.
(Spot silver daily chart, source: EasyForex)
This Week's Outlook and Scenario Analysis
Scenario 1: Mean Reversion Bullish Scenario. If the gold-silver ratio falls from its current high and breaks below the 62 level, it indicates that silver is starting to catch up with gold's decline or that gold is experiencing a correction. Silver is expected to see a phase of rebound, targeting the $68-$70 resistance zone. In this scenario, gold needs to stabilize or rebound moderately to provide sentiment support for silver.
Scenario 2: Further Expanding the Bearish Scenario. If the gold-silver ratio widens further to above 68 or even 70, it will confirm that silver is still being systematically sold off by the market, with selling pressure stronger than that on gold. The support level around $63.60 will face a severe test. Catalysts for this scenario could be a further strengthening of the US dollar, a more hawkish signal from the Federal Reserve, or an unexpectedly severe deterioration in industrial demand data.
At 11:55 AM Beijing time on June 10, spot silver was trading at $64.04 per ounce.
- Risk Warning and Disclaimer
- The market involves risk, and trading may not be suitable for all investors. This article is for reference only and does not constitute personal investment advice, nor does it take into account certain users’ specific investment objectives, financial situation, or other needs. Any investment decisions made based on this information are at your own risk.