USD/JPY continues to rise: Is there a ceiling to the rise?
2026-06-11 18:55:35
On Thursday (June 11), during the European session, the USD/JPY pair reached 160.585, its highest level since July 2024. Even with a significant rise in Japanese producer price inflation, the pressure on the yen to depreciate has not eased.
Latest data shows that Japan's Producer Price Index (PPI) rose 6.1% year-on-year in May, higher than the revised 5.3% in April and exceeding market expectations of 5.5%, reaching a three-year high. Rising energy prices and a weakening yen were the two main factors driving up producer prices.
This better-than-expected inflation data further reinforced market expectations that the Bank of Japan may raise interest rates at its next policy meeting. Affected by the situation in the Middle East and the continued depreciation of the yen, inflationary pressures are intensifying, and the market generally believes that the Bank of Japan must take countermeasures.
The market is also closely watching the statements of Bank of Japan Governor Kazuo Ueda, attempting to glean clear signals about the future direction of monetary policy. Investors are currently pricing in the possibility of another rate hike in September, while not ruling out the possibility of a further rate hike in December.
Even with rising expectations of interest rate hikes, the yen remains weak. A stronger dollar, coupled with market expectations that the Federal Reserve will maintain its tight monetary policy, has a far greater impact than any potential benefits from a potential interest rate hike by the Bank of Japan.
Technical Analysis
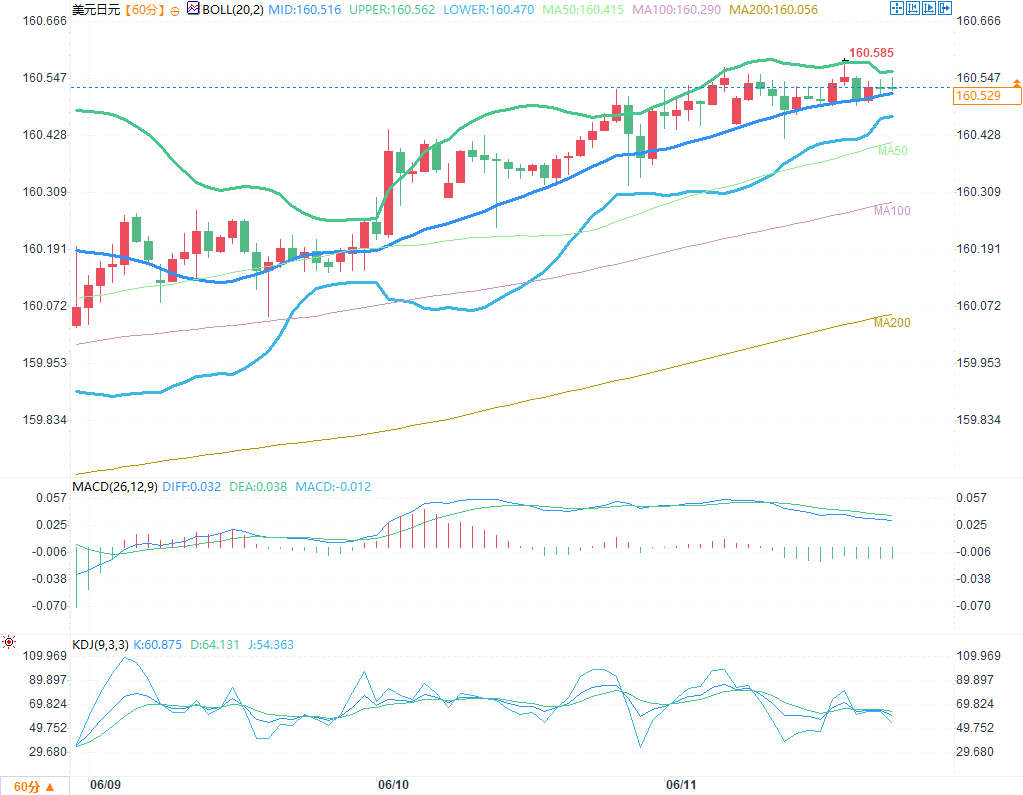
(USD/JPY 1-hour chart source: EasyForex)
Looking at the USD/JPY 1-hour chart, the price has formed a clear breakout continuation pattern:
Key price level: The exchange rate stabilized above 160.50, broke through the upper edge of the previous consolidation range (160.50), and reached a high of 160.585. The Bollinger Bands opened upward, with the upper and middle bands moving upward in tandem, indicating a strong continuation of the bullish trend.
Moving average system: The price is running above all moving averages, including MA50, MA100, and MA200, and the moving averages are in a standard bullish alignment. The short-term support level around 160.50 has turned from previous resistance into strong support.
Indicator signals: Although the MACD red bars have shortened slightly, the DIFF line is still running above the zero axis, and the bullish momentum has not shown obvious signs of exhaustion; the KDJ indicator's K line has fallen back to around 60, but has not yet entered the overbought zone, and there is still upward momentum in the short term.
Overall, the current bullish trend is solid, and it may fluctuate and digest in the 160.50-160.60 range in the short term. If it can hold above the upper Bollinger Band (160.562), it is expected to further test the previous high. The main strategy is to buy on dips, but be wary of the short-term volatility risk brought about by the Bank of Japan's intervention.
Summarize
Despite growing market optimism regarding further interest rate hikes by the Bank of Japan, the USD/JPY exchange rate continues to strengthen, driven by a strong US dollar and expectations of a prolonged tightening policy by the Federal Reserve. The current bullish trend in this currency pair is solid; however, as the exchange rate approaches multi-year highs, the market will become increasingly sensitive to signals of Japanese government intervention in the foreign exchange market and policy adjustments.
Latest data shows that Japan's Producer Price Index (PPI) rose 6.1% year-on-year in May, higher than the revised 5.3% in April and exceeding market expectations of 5.5%, reaching a three-year high. Rising energy prices and a weakening yen were the two main factors driving up producer prices.
This better-than-expected inflation data further reinforced market expectations that the Bank of Japan may raise interest rates at its next policy meeting. Affected by the situation in the Middle East and the continued depreciation of the yen, inflationary pressures are intensifying, and the market generally believes that the Bank of Japan must take countermeasures.
The market is also closely watching the statements of Bank of Japan Governor Kazuo Ueda, attempting to glean clear signals about the future direction of monetary policy. Investors are currently pricing in the possibility of another rate hike in September, while not ruling out the possibility of a further rate hike in December.
Even with rising expectations of interest rate hikes, the yen remains weak. A stronger dollar, coupled with market expectations that the Federal Reserve will maintain its tight monetary policy, has a far greater impact than any potential benefits from a potential interest rate hike by the Bank of Japan.
Technical Analysis
(USD/JPY 1-hour chart source: EasyForex)
Looking at the USD/JPY 1-hour chart, the price has formed a clear breakout continuation pattern:
Key price level: The exchange rate stabilized above 160.50, broke through the upper edge of the previous consolidation range (160.50), and reached a high of 160.585. The Bollinger Bands opened upward, with the upper and middle bands moving upward in tandem, indicating a strong continuation of the bullish trend.
Moving average system: The price is running above all moving averages, including MA50, MA100, and MA200, and the moving averages are in a standard bullish alignment. The short-term support level around 160.50 has turned from previous resistance into strong support.
Indicator signals: Although the MACD red bars have shortened slightly, the DIFF line is still running above the zero axis, and the bullish momentum has not shown obvious signs of exhaustion; the KDJ indicator's K line has fallen back to around 60, but has not yet entered the overbought zone, and there is still upward momentum in the short term.
Overall, the current bullish trend is solid, and it may fluctuate and digest in the 160.50-160.60 range in the short term. If it can hold above the upper Bollinger Band (160.562), it is expected to further test the previous high. The main strategy is to buy on dips, but be wary of the short-term volatility risk brought about by the Bank of Japan's intervention.
Summarize
Despite growing market optimism regarding further interest rate hikes by the Bank of Japan, the USD/JPY exchange rate continues to strengthen, driven by a strong US dollar and expectations of a prolonged tightening policy by the Federal Reserve. The current bullish trend in this currency pair is solid; however, as the exchange rate approaches multi-year highs, the market will become increasingly sensitive to signals of Japanese government intervention in the foreign exchange market and policy adjustments.
- Risk Warning and Disclaimer
- The market involves risk, and trading may not be suitable for all investors. This article is for reference only and does not constitute personal investment advice, nor does it take into account certain users’ specific investment objectives, financial situation, or other needs. Any investment decisions made based on this information are at your own risk.