Behind WTI falling below $90: The market is not really selling crude oil, but rather the conflict premium.
2026-06-11 20:15:20
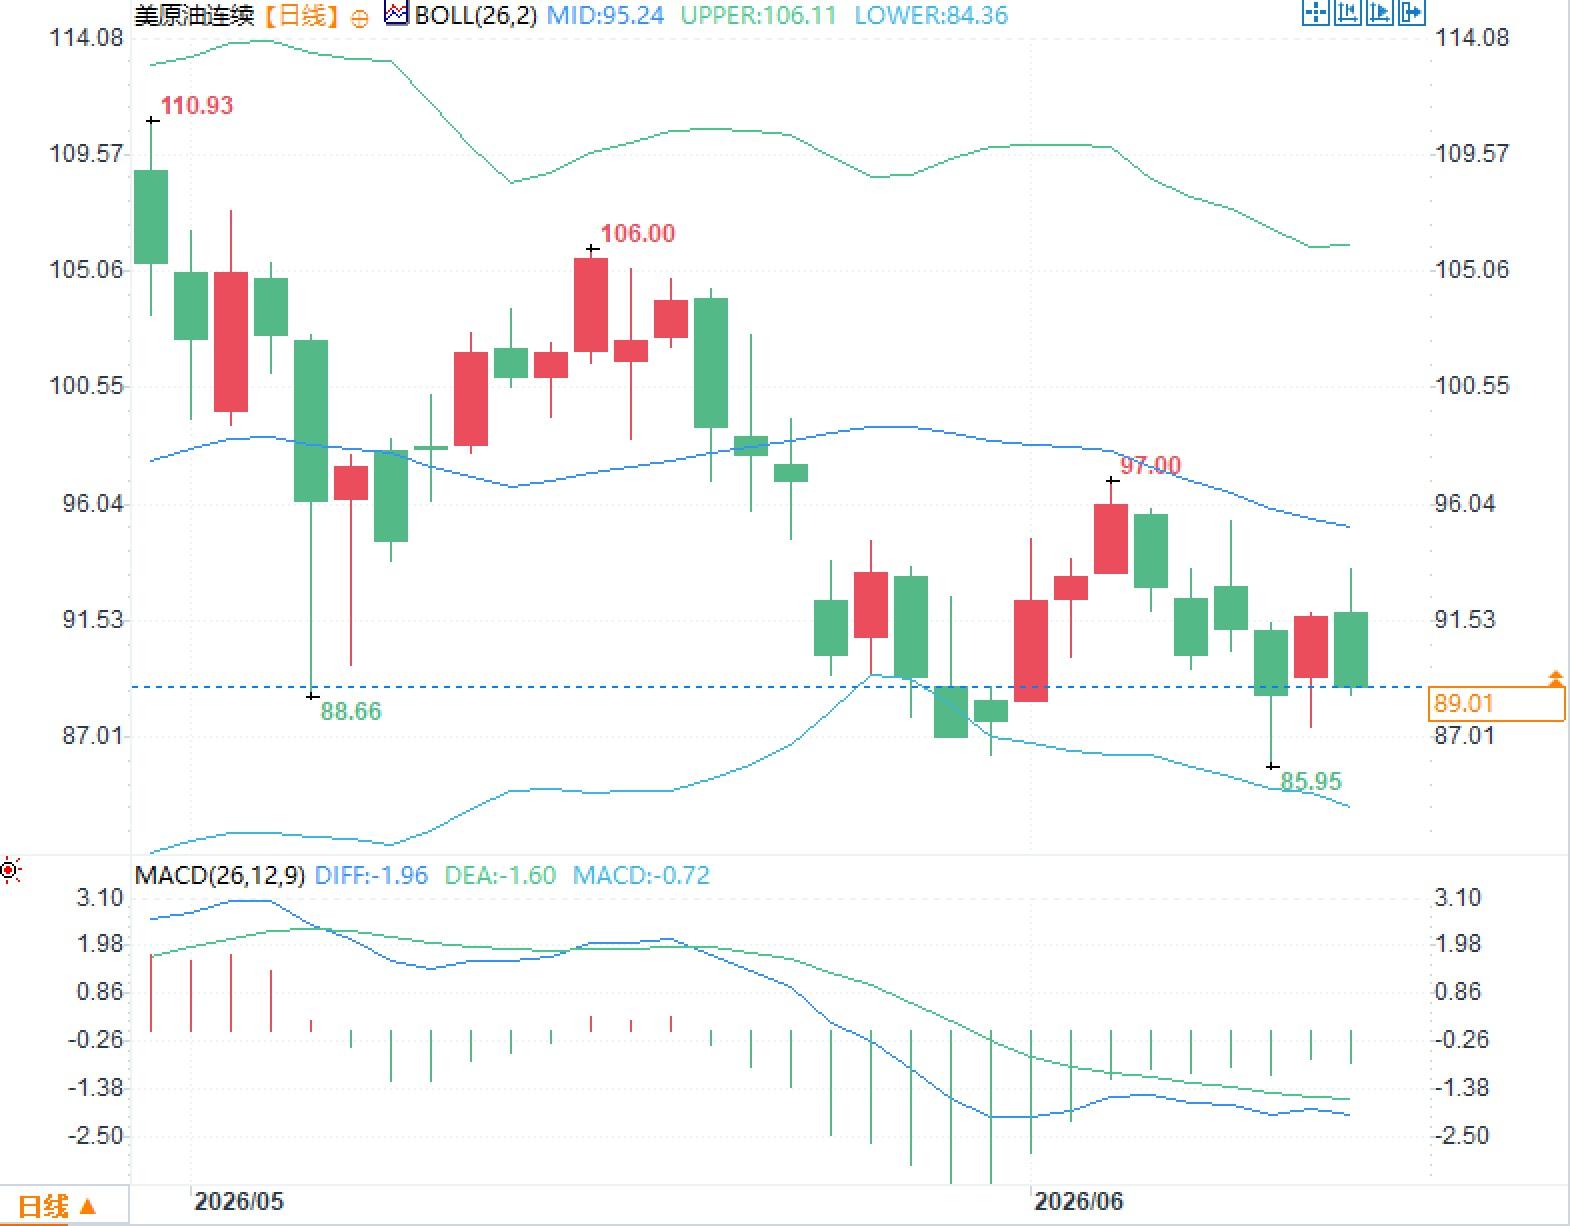
On Thursday, June 11th, the main theme in the crude oil market shifted from a simple geopolitical risk premium to a repricing driven by "expectations of de-escalation of conflict and tight physical supply." WTI crude oil futures are currently trading around $89 per barrel, still below the Bollinger Middle Band at $95.24, with the MACD indicator remaining in negative territory. The market is not denying supply tightness, but rather anticipating a reduction in the premium associated with escalating conflict.

The immediate trigger for this round of WTI price decline was the market's reassessment of the probability that negotiations between the US and Iran would continue uninterrupted. Public information indicates that Qatari officials have traveled to Tehran to push for a peace agreement between the US and Iran, against the backdrop of recent clashes between the two sides, which had led to speculation that negotiations might be stalled.
This explains the contradiction in the market: on the one hand, the fundamentals of the crude oil spot market remain tight; on the other hand, futures prices have retreated from previous highs. Traders need to distinguish between two types of premiums: the first is a verifiable physical shortage premium, stemming from declining inventories, high refinery utilization rates, and restricted shipping; the second is an event-driven panic premium, arising from the tail risk of further escalation of the conflict. Currently, the second type is primarily being compressed, rather than the first.
From a technical perspective, the area around 97.00 on the daily chart represents a recent high for the rebound, while 85.95 serves as a low reference point. The lower Bollinger Band at 84.36 is still trending downwards, indicating that the price has not yet re-established an upward trend. More importantly, the MACD's DIF is -1.96, DEA is -1.60, and the histogram is -0.72, showing insufficient rebound momentum. In other words, the price around 89 is not simply undervalued, but rather the market is awaiting confirmation of a new direction from negotiations, shipping routes, and inventory data.
The latest weekly data does not support the conclusion that "supply has become ample." As of the week ending June 5, U.S. commercial crude oil inventories fell to 426.5 million barrels, a decrease of 7.2 million barrels per day; strategic reserves fell to 349.2 million barrels, a decrease of 7.9 million barrels per day. During the same period, U.S. crude oil production was 13.799 million barrels per day, refinery inputs reached 16.962 million barrels per day, and refinery utilization rose to 95.3%. These figures indicate that refining operations are still running at high capacity, and the inventory decline is not an isolated event, but rather a result of continued depletion due to supply chain tensions.
However, the positive impact of increased inventory levels cannot be simply extrapolated linearly. High oil prices have begun to suppress demand. The latest Short-Term Energy Outlook projects that global oil consumption will decrease by 1.1 million barrels per day in 2026, compared to 104 million barrels per day in 2025. The agency had previously projected a demand increase of 200,000 barrels per day in May and 1.2 million barrels per day in February, indicating a significant downward revision to its demand assumptions.
This has a direct implication for WTI: tight inventories can support the near end of the curve, but downward revisions in demand will limit long-term valuations. If refinery profits continue to rely on diesel and jet fuel crack spreads, while end-user consumption is suppressed by high prices, the upside potential for crude oil will depend more on the duration of supply disruptions than on the traditional peak season narrative.
The latest decision from the oil-producing alliance indicates that the seven participating countries will implement a production adjustment of 188,000 barrels per day in July, emphasizing that adjustments can be increased, suspended, or reversed depending on market conditions. The emphasis here is not on the word "increase in production," but on "flexibility." This is because, given the transportation constraints in the Gulf region and the inability to fully utilize some production capacity, there is a significant gap between nominal quotas and actual deliveries.
On the supply side, what really needs to be monitored is not the announced production volume, but three sets of variables: available shipping capacity, insurance and freight costs, and the throughput capacity of alternative shipping routes. As long as the transportation bottlenecks are not substantially alleviated, the quota change of 188,000 barrels per day is more like policy rhetoric to stabilize expectations than an immediate change in the actual flow of goods in the global balance sheet.
A more significant structural shift lies in the response to alternative supplies. The Short-Term Energy Outlook indicates that, affected by shipping disruptions, U.S. net exports of crude oil and refined products reached a record high of 5.8 million barrels per day in April, and are projected to average 4.2 million barrels per day in 2026, an increase of 1.4 million barrels per day from 2025. This increase helps buffer the gap, but it cannot fully replace the supply of high-sulfur crude oil, condensate, and middle distillates from the affected regions.
The current challenge for WTI is that bullish and bearish factors are not on the same time scale. In the short term, rapidly declining inventories, high refinery utilization rates, and transportation constraints continue to support near-term contracts; in the medium term, high prices lead to downward revisions in demand, negotiations are still progressing, and quota policies remain flexible, which suppresses the risk premium in the far-term contracts.
A May report from the International Energy Agency indicated that global oil supply further declined by 1.8 million barrels per day in April to 95.1 million barrels per day, bringing the cumulative loss since February to 12.8 million barrels per day. The report also projected that if traffic in the Strait of Hormuz gradually recovers, global supply will still decline by an average of 3.9 million barrels per day in 2026, to 102.2 million barrels per day. This assessment suggests that even if supply recovers, it does not mean that inventory pressure will immediately disappear.
Therefore, WTI's pricing around 89 is not a sign of "bearish fundamentals," but rather a way of removing the most extreme conflict risks from the price. The key to subsequent volatility lies not in single-day fluctuations, but in whether three key factors change in sync: whether negotiations reduce transportation risks, whether inventories stop declining sharply, and whether downward revisions in demand spread to gasoline and distillate fuel consumption. If these three factors move in opposite directions, oil prices are likely to maintain high volatility rather than a one-sided trend.
I. Key Market Analysis: The decline in oil prices is not due to ample supply, but rather a retracement of risk premiums.
The immediate trigger for this round of WTI price decline was the market's reassessment of the probability that negotiations between the US and Iran would continue uninterrupted. Public information indicates that Qatari officials have traveled to Tehran to push for a peace agreement between the US and Iran, against the backdrop of recent clashes between the two sides, which had led to speculation that negotiations might be stalled.
This explains the contradiction in the market: on the one hand, the fundamentals of the crude oil spot market remain tight; on the other hand, futures prices have retreated from previous highs. Traders need to distinguish between two types of premiums: the first is a verifiable physical shortage premium, stemming from declining inventories, high refinery utilization rates, and restricted shipping; the second is an event-driven panic premium, arising from the tail risk of further escalation of the conflict. Currently, the second type is primarily being compressed, rather than the first.
From a technical perspective, the area around 97.00 on the daily chart represents a recent high for the rebound, while 85.95 serves as a low reference point. The lower Bollinger Band at 84.36 is still trending downwards, indicating that the price has not yet re-established an upward trend. More importantly, the MACD's DIF is -1.96, DEA is -1.60, and the histogram is -0.72, showing insufficient rebound momentum. In other words, the price around 89 is not simply undervalued, but rather the market is awaiting confirmation of a new direction from negotiations, shipping routes, and inventory data.
II. Fundamentals: A sharp drop in inventories supports the bottom of oil prices, but demand is showing signs of weakening.
The latest weekly data does not support the conclusion that "supply has become ample." As of the week ending June 5, U.S. commercial crude oil inventories fell to 426.5 million barrels, a decrease of 7.2 million barrels per day; strategic reserves fell to 349.2 million barrels, a decrease of 7.9 million barrels per day. During the same period, U.S. crude oil production was 13.799 million barrels per day, refinery inputs reached 16.962 million barrels per day, and refinery utilization rose to 95.3%. These figures indicate that refining operations are still running at high capacity, and the inventory decline is not an isolated event, but rather a result of continued depletion due to supply chain tensions.
However, the positive impact of increased inventory levels cannot be simply extrapolated linearly. High oil prices have begun to suppress demand. The latest Short-Term Energy Outlook projects that global oil consumption will decrease by 1.1 million barrels per day in 2026, compared to 104 million barrels per day in 2025. The agency had previously projected a demand increase of 200,000 barrels per day in May and 1.2 million barrels per day in February, indicating a significant downward revision to its demand assumptions.
This has a direct implication for WTI: tight inventories can support the near end of the curve, but downward revisions in demand will limit long-term valuations. If refinery profits continue to rely on diesel and jet fuel crack spreads, while end-user consumption is suppressed by high prices, the upside potential for crude oil will depend more on the duration of supply disruptions than on the traditional peak season narrative.
III. Supply Side: The Signal Significance of Quota Increases Outweighs the Actual Increase
The latest decision from the oil-producing alliance indicates that the seven participating countries will implement a production adjustment of 188,000 barrels per day in July, emphasizing that adjustments can be increased, suspended, or reversed depending on market conditions. The emphasis here is not on the word "increase in production," but on "flexibility." This is because, given the transportation constraints in the Gulf region and the inability to fully utilize some production capacity, there is a significant gap between nominal quotas and actual deliveries.
On the supply side, what really needs to be monitored is not the announced production volume, but three sets of variables: available shipping capacity, insurance and freight costs, and the throughput capacity of alternative shipping routes. As long as the transportation bottlenecks are not substantially alleviated, the quota change of 188,000 barrels per day is more like policy rhetoric to stabilize expectations than an immediate change in the actual flow of goods in the global balance sheet.
A more significant structural shift lies in the response to alternative supplies. The Short-Term Energy Outlook indicates that, affected by shipping disruptions, U.S. net exports of crude oil and refined products reached a record high of 5.8 million barrels per day in April, and are projected to average 4.2 million barrels per day in 2026, an increase of 1.4 million barrels per day from 2025. This increase helps buffer the gap, but it cannot fully replace the supply of high-sulfur crude oil, condensate, and middle distillates from the affected regions.
IV. Pricing Logic: WTI is trading on "cooling expectations amid a tight balance".
The current challenge for WTI is that bullish and bearish factors are not on the same time scale. In the short term, rapidly declining inventories, high refinery utilization rates, and transportation constraints continue to support near-term contracts; in the medium term, high prices lead to downward revisions in demand, negotiations are still progressing, and quota policies remain flexible, which suppresses the risk premium in the far-term contracts.
A May report from the International Energy Agency indicated that global oil supply further declined by 1.8 million barrels per day in April to 95.1 million barrels per day, bringing the cumulative loss since February to 12.8 million barrels per day. The report also projected that if traffic in the Strait of Hormuz gradually recovers, global supply will still decline by an average of 3.9 million barrels per day in 2026, to 102.2 million barrels per day. This assessment suggests that even if supply recovers, it does not mean that inventory pressure will immediately disappear.
Therefore, WTI's pricing around 89 is not a sign of "bearish fundamentals," but rather a way of removing the most extreme conflict risks from the price. The key to subsequent volatility lies not in single-day fluctuations, but in whether three key factors change in sync: whether negotiations reduce transportation risks, whether inventories stop declining sharply, and whether downward revisions in demand spread to gasoline and distillate fuel consumption. If these three factors move in opposite directions, oil prices are likely to maintain high volatility rather than a one-sided trend.
- Risk Warning and Disclaimer
- The market involves risk, and trading may not be suitable for all investors. This article is for reference only and does not constitute personal investment advice, nor does it take into account certain users’ specific investment objectives, financial situation, or other needs. Any investment decisions made based on this information are at your own risk.