GBP/USD Forex Signals: When Will the Consolidation End?
2026-06-11 19:41:12
On Thursday (June 11), the British pound against the US dollar exhibited a volatile trading pattern, initially testing the lows before rebounding, then rising and falling back before rebounding again. The price fluctuated repeatedly around the moving average, eventually closing near 1.3364. The RSI indicator suggests that the market's short-term momentum is neutral to slightly bullish.
The pound has been consolidating against the dollar for quite some time. This week, the market was expected to see a decisive catalyst – a hardening US stance on Iran and the release of yesterday's expected US Consumer Price Index (CPI) data. However, neither of these events provided clear directional guidance for the dollar's movement, and the pound/dollar exchange rate failed to break out of its consolidation pattern.
There are no permanent consolidation periods in the market. Therefore, the most reasonable trading strategy at present is to: clearly define the operating range of this consolidation, identify the technical and fundamental triggers that could end the oscillation, and accurately identify the signals that indicate a breakout.
The boundaries of the consolidation range are gradually becoming clearer.
Without delving into the technical details, there are two key reasons for focusing on this currency pair at present. First, the market has formed a clear consolidation pattern, which can serve as a core basis for judging subsequent breakouts. Second, the US dollar index has maintained a relatively strong consolidation trend below its monthly high and is about to choose a direction. Whether it breaks upwards or reverses downwards, it will directly affect the GBP/USD exchange rate.
In addition, new variables have emerged in market fundamentals: the Trump administration has adjusted its policy toward Iran, adopting a more confrontational stance and showing significantly less patience in the Iran nuclear deal negotiations. This change has a significant impact on the foreign exchange market—escalating geopolitical risks trigger risk aversion, thereby boosting the US dollar; simultaneously, heightened tensions are likely to push up oil prices, and rising oil prices will further exacerbate inflationary pressures, indirectly benefiting the US dollar. Currently, military conflict may not necessarily trigger strong risk aversion, nor will it necessarily drive oil prices significantly higher, but this potential risk has already become a significant disruptive factor in the market.
Technical Analysis
(GBP/USD daily chart source: FX678)
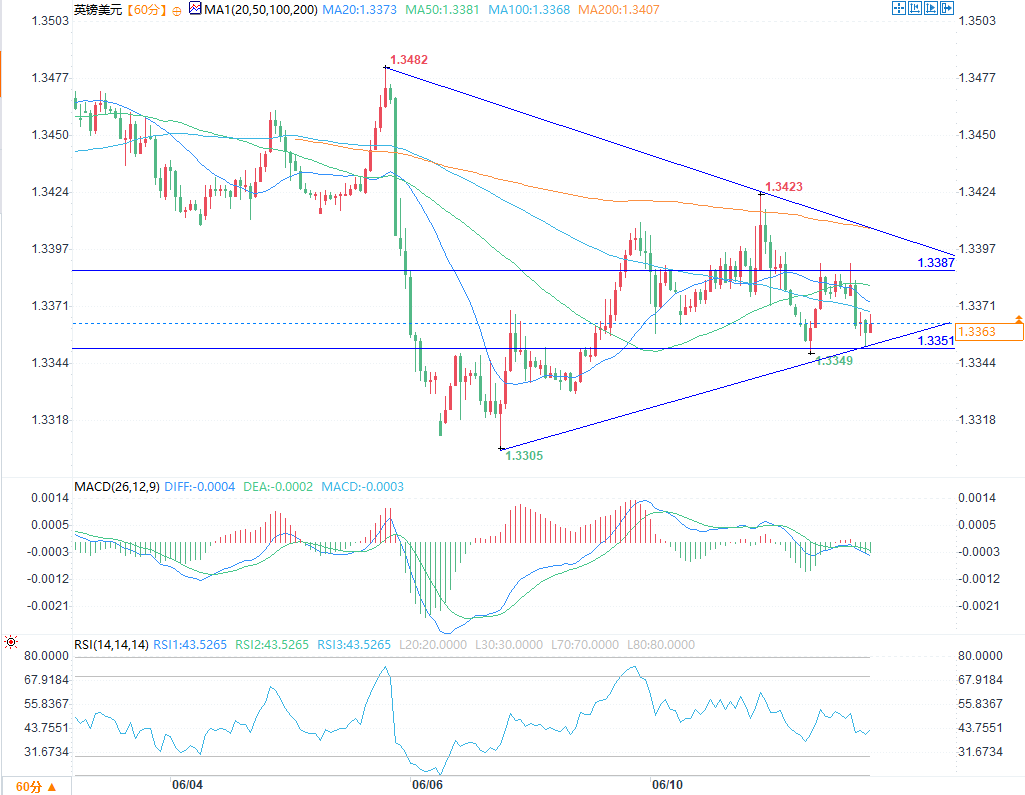
From the exchange rate chart, the most crucial technical pattern currently is a converging triangle. This pattern is not only a typical characteristic of consolidation markets, but it also indicates that once the exchange rate breaks through the upper and lower trend lines of the triangle, it will initiate a new round of directional movement. If the trend line resonates with key support and resistance levels, it will become a core signal for accurately judging the exchange rate trend.
Another key trend is that the exchange rate has been gradually declining over the past few weeks. This trend is mainly driven by the strengthening of the US dollar. The pound itself does not have a clear bullish or bearish driving logic, and its fundamentals are lackluster.
The lower trendline of the triangle pattern coincides with the key support level of $1.3351, which is also close to the psychological level of $1.3350, creating strong support and serving as a crucial dividing line between bullish and bearish sentiment for today's market. Combined with the risk aversion sentiment driven by the escalating situation in Iran, the probability of a downward breakout is higher, and the overall trend is bearish. Furthermore, the recent repeated resistance levels at $1.3387 and subsequent pullbacks further confirm the bearish advantage, indicating minimal downside resistance at present.
Core Market Analysis
In summary, the best trading strategy is to wait and see, and then enter the market after the exchange rate touches the upper or lower trend lines of the converging triangle. In the short term, a breakout in the exchange rate is highly probable today. Historical trends show that the GBP/USD pair responds strongly to triangle breakout patterns, making a downward breakout more likely in this instance.
However, it should be noted that this trading signal has certain flaws: the support and resistance levels above and below the breakout range are relatively balanced, limiting the profit potential. Therefore, this is not a high-value trading opportunity.
Long-term trading strategy
Entry timing: When a bullish reversal pattern appears on the 1-hour chart and the exchange rate touches the support level of $1.3351 or $1.3332 for the first time, go long.
Stop loss setting: Place it 1 basis point below the recent local low.
Capital preservation and stop loss: After the position has made a profit of 25 basis points, adjust the stop loss level to the entry price to lock in the safety of the principal.
Profit-taking strategy: When the profit reaches 25 basis points, close 50% of the position and hold the remaining position to speculate on further market movements.
Short selling strategy
Entry point: When a bearish reversal pattern appears on the 1-hour chart and the exchange rate first touches the resistance levels of $1.3387, $1.3411, or $1.3424, go short.
Stop-loss setting: Place it 1 basis point above the recent local high.
Capital preservation and stop loss: After the position has made a profit of 25 basis points, adjust the stop loss level to the entry price to lock in the safety of the principal.
Profit-taking strategy: When the profit reaches 25 basis points, close 50% of the position and hold the remaining position to speculate on further market movements.
On the fundamental side, no major economic data will be released in the UK today; the US Producer Price Index (PPI) data will be released at 20:30 Beijing time (13:30 London time), which may cause short-term market fluctuations.
The pound has been consolidating against the dollar for quite some time. This week, the market was expected to see a decisive catalyst – a hardening US stance on Iran and the release of yesterday's expected US Consumer Price Index (CPI) data. However, neither of these events provided clear directional guidance for the dollar's movement, and the pound/dollar exchange rate failed to break out of its consolidation pattern.
There are no permanent consolidation periods in the market. Therefore, the most reasonable trading strategy at present is to: clearly define the operating range of this consolidation, identify the technical and fundamental triggers that could end the oscillation, and accurately identify the signals that indicate a breakout.
The boundaries of the consolidation range are gradually becoming clearer.
Without delving into the technical details, there are two key reasons for focusing on this currency pair at present. First, the market has formed a clear consolidation pattern, which can serve as a core basis for judging subsequent breakouts. Second, the US dollar index has maintained a relatively strong consolidation trend below its monthly high and is about to choose a direction. Whether it breaks upwards or reverses downwards, it will directly affect the GBP/USD exchange rate.
In addition, new variables have emerged in market fundamentals: the Trump administration has adjusted its policy toward Iran, adopting a more confrontational stance and showing significantly less patience in the Iran nuclear deal negotiations. This change has a significant impact on the foreign exchange market—escalating geopolitical risks trigger risk aversion, thereby boosting the US dollar; simultaneously, heightened tensions are likely to push up oil prices, and rising oil prices will further exacerbate inflationary pressures, indirectly benefiting the US dollar. Currently, military conflict may not necessarily trigger strong risk aversion, nor will it necessarily drive oil prices significantly higher, but this potential risk has already become a significant disruptive factor in the market.
Technical Analysis
(GBP/USD daily chart source: FX678)
From the exchange rate chart, the most crucial technical pattern currently is a converging triangle. This pattern is not only a typical characteristic of consolidation markets, but it also indicates that once the exchange rate breaks through the upper and lower trend lines of the triangle, it will initiate a new round of directional movement. If the trend line resonates with key support and resistance levels, it will become a core signal for accurately judging the exchange rate trend.
Another key trend is that the exchange rate has been gradually declining over the past few weeks. This trend is mainly driven by the strengthening of the US dollar. The pound itself does not have a clear bullish or bearish driving logic, and its fundamentals are lackluster.
The lower trendline of the triangle pattern coincides with the key support level of $1.3351, which is also close to the psychological level of $1.3350, creating strong support and serving as a crucial dividing line between bullish and bearish sentiment for today's market. Combined with the risk aversion sentiment driven by the escalating situation in Iran, the probability of a downward breakout is higher, and the overall trend is bearish. Furthermore, the recent repeated resistance levels at $1.3387 and subsequent pullbacks further confirm the bearish advantage, indicating minimal downside resistance at present.
Core Market Analysis
In summary, the best trading strategy is to wait and see, and then enter the market after the exchange rate touches the upper or lower trend lines of the converging triangle. In the short term, a breakout in the exchange rate is highly probable today. Historical trends show that the GBP/USD pair responds strongly to triangle breakout patterns, making a downward breakout more likely in this instance.
However, it should be noted that this trading signal has certain flaws: the support and resistance levels above and below the breakout range are relatively balanced, limiting the profit potential. Therefore, this is not a high-value trading opportunity.
Long-term trading strategy
Entry timing: When a bullish reversal pattern appears on the 1-hour chart and the exchange rate touches the support level of $1.3351 or $1.3332 for the first time, go long.
Stop loss setting: Place it 1 basis point below the recent local low.
Capital preservation and stop loss: After the position has made a profit of 25 basis points, adjust the stop loss level to the entry price to lock in the safety of the principal.
Profit-taking strategy: When the profit reaches 25 basis points, close 50% of the position and hold the remaining position to speculate on further market movements.
Short selling strategy
Entry point: When a bearish reversal pattern appears on the 1-hour chart and the exchange rate first touches the resistance levels of $1.3387, $1.3411, or $1.3424, go short.
Stop-loss setting: Place it 1 basis point above the recent local high.
Capital preservation and stop loss: After the position has made a profit of 25 basis points, adjust the stop loss level to the entry price to lock in the safety of the principal.
Profit-taking strategy: When the profit reaches 25 basis points, close 50% of the position and hold the remaining position to speculate on further market movements.
On the fundamental side, no major economic data will be released in the UK today; the US Producer Price Index (PPI) data will be released at 20:30 Beijing time (13:30 London time), which may cause short-term market fluctuations.
- Risk Warning and Disclaimer
- The market involves risk, and trading may not be suitable for all investors. This article is for reference only and does not constitute personal investment advice, nor does it take into account certain users’ specific investment objectives, financial situation, or other needs. Any investment decisions made based on this information are at your own risk.