USD/JPY surged and then retreated, leaving a long upper shadow. With only three days left before the Bank of Japan's decision, are the bears about to overturn the table?
2026-06-12 21:05:21
On Friday (June 12), USD/JPY traded around 160.18, with the market experiencing a typical pre-meeting lull. After rising to 160.59 yesterday, the price quickly retreated, and the long upper shadow on the candlestick chart continues to suppress further bullish attempts. Driving this cautious sentiment is the high degree of certainty surrounding the Bank of Japan's policy meeting next Tuesday, and the sudden uncertainty surrounding its quantitative tightening path.
The market logic is shifting from simple interest rate carry trades to a repricing of the supply and demand dynamics of Japanese government bonds. A well-known institution reported that the Bank of Japan may consider pausing its bond-buying program in fiscal year 2027, or even shifting to open-ended purchases. Following this news, the Japanese government bond yield curve flattened in a bullish manner: the 10-year yield fell 4.5 basis points to 2.635%, and the 30-year yield plummeted 6.5 basis points. This should have supported the yen through the narrowing interest rate differential, but the exchange rate reaction was muted. The market seems more concerned about another signal—whether pausing balance sheet reduction signifies a deeper concern by the central bank about runaway long-term interest rates.
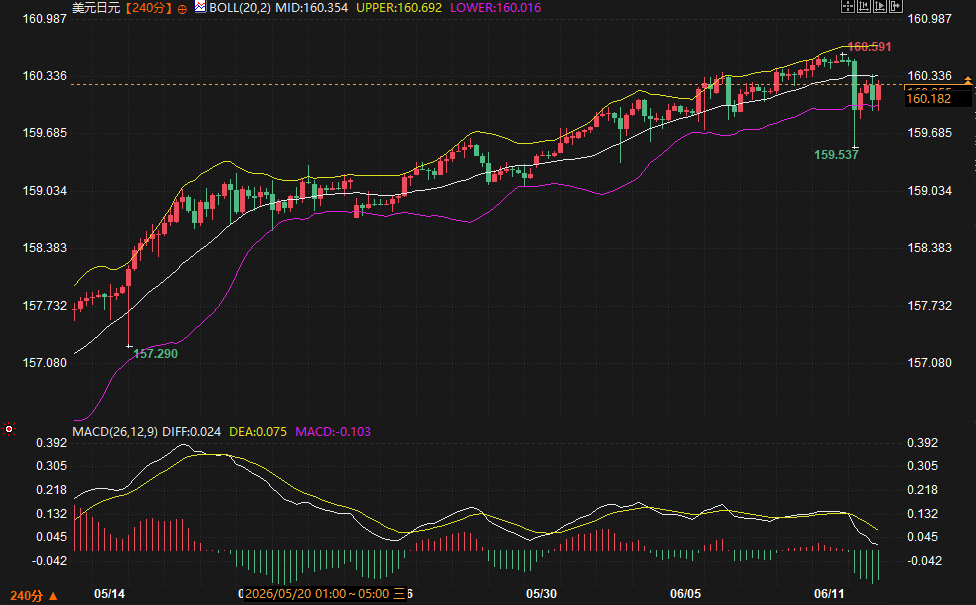
From a price action perspective, the pullback after encountering resistance at the high of 160.59 was confirmed by a MACD death cross on the 240-minute chart. The DIFF fast line crossed below the DEA slow line, and the green histogram bars showed a moderate increase in volume, indicating short-term bearish momentum. The price is currently trading between the Bollinger Band middle line at 160.35 and the lower band at 160.02, closely following the middle line. Considering that the Bollinger Bands are generally narrowing and volatility has compressed to recent lows, this suggests that the energy for a breakout is accumulating, and a directional move is imminent.
Friday's behavior in the Japanese government bond market was itself a paradox. The decline in yields was ostensibly driven by safe-haven buying – following the US cancellation of its planned attack on Iran and falling oil prices suppressing inflation expectations – but the anomaly was that ultra-long-term yields fell far more sharply than short-term yields, with the 30-year yield dropping 6.5 basis points on the day.
This strong buying at the ultra-long end is directly related to news that the Bank of Japan may pause its bond-buying program. According to sources, even if the Bank of Japan stops actively reducing its balance sheet, of the approximately 530 trillion yen in government bonds held, nearly 50 trillion yen will naturally mature each year. Some policymakers believe that this passive balance sheet reduction is sufficient, and that forced active reduction could lead to insufficient market absorption capacity. This logic itself is favorable for the yen: if the central bank slows down tightening to ensure bond market stability, its policy rate normalization process will be more cautious. However, the market is clearly interpreting this in reverse—the pause in balance sheet reduction is seen as the central bank's tacit acceptance of Japan's high long-term interest rates, thus narrowing the space for a narrowing of the real interest rate differential between the US and Japan, which limits the extent to which the yen strengthens due to expectations of interest rate hikes.
The probability of the Bank of Japan raising interest rates by 25 basis points to 1% next Tuesday has already reached 97% in the overnight index swap market. This has already been fully priced in, explaining why the yen has been slow to react to expectations of a rate hike. The real focus of the game will be the subsequent press conference. Due to Kazuo Ueda's hospitalization for a liver cyst, Deputy Governor Shinichi Uchida will attend in his place. A trader from a Japanese brokerage firm is circulating in the market with the opinion that "Uchida's wording may be more hawkish than Ueda's." This expectation has not yet been fully priced in.
The technical analysis framework is very clear, and fundamental events are filling in the driving logic for it.
Reference Contract: Spot USD/JPY
The upper resistance range is 160.35-160.59 (from the Bollinger Band middle line to yesterday's high).
The Bollinger Band middle line overlaps with short-term psychological resistance here. A successful breakout and hold above the middle line would indicate that the short-term pullback pressure has been released, at which point the bearish pressure from the MACD death cross would weaken. If the hourly chart shows repeated upper shadows in this range, we should be wary of momentum exhaustion.
Support zone below: 160.02-159.54 (lower Bollinger Band to Wednesday's pullback low).
If the price breaks below the lower Bollinger Band, the Bollinger Bands will narrow and then open downwards, establishing a short-term bearish structure. Technical selling pressure could push the price towards the recent pullback low of 159.54.
Key focus during the trading session: The movement of the Japanese government bond market in the Tokyo morning session is a key leading indicator. If ultra-long-term yields continue to decline rapidly, Japanese bank stocks may come under pressure, while USD/JPY often finds buying support during the Asian session. Conversely, if yields stabilize and rebound, it will suggest that market concerns about a pause in balance sheet reduction have eased, which is conducive to a technical rebound in the yen.
Over the next three trading days, USD/JPY will likely fluctuate within the narrowing range formed by the Bollinger Bands, but the Bank of Japan's decision next Tuesday will break this deadlock. A single 25 basis point rate hike is unlikely to sway a trend; the details of the quantitative tightening path are the key variable determining the direction. The current market consensus is that the Bank of Japan will convey a gradual and moderate normalization path. If the suspension of bond purchases is confirmed, it will effectively limit the upside potential of long-term Japanese government bond yields, thereby weakening the sustained buying interest in the yen due to the rate hike. Technically, if the price breaks through 160.59 effectively after the decision and continues to trade above the middle Bollinger Band, the medium-term upward structure will continue; conversely, if Shinichi Uchida's remarks indicate limited tolerance for inflation overshooting, coupled with maintaining the current pace of balance sheet reduction, USD/JPY may test the support level around 159.00.
Why might the Bank of Japan's suspension of balance sheet reduction actually be detrimental to the strengthening of the yen?
A pause in balance sheet reduction is often interpreted by the market as a sign of central bank concerns about the stability of the bond market, which would limit the upside potential for long-term interest rates. Although short-term policy rates are rising, if long-term interest rates are kept under control, the narrowing of the US-Japan interest rate differential will be limited, which would weaken the fundamental support the yen has gained from interest rate hikes.
Why did the expectation of a 25 basis point interest rate hike by the Bank of Japan fail to boost the yen?
The overnight index swap market has already priced in as much as 97% of this rate hike, meaning the market has fully priced it in. When expectations are "realized" without any unexpected news, it often triggers "buy the rumor, sell the fact" trading behavior. Currently, the market's attention has shifted to the timing of the next rate hike and the details of balance sheet reduction.
What is the technical significance of the current sideways consolidation in USD/JPY?
On the 240-minute chart, the Bollinger Bands are narrowing, accompanied by a MACD death cross, a common consolidation pattern awaiting a breakout. The price action has been compressed to between 160.02 and 160.69, indicating a potential one-sided trend is brewing. This narrowing pattern typically doesn't last long, and given next week's fundamental impact, the momentum for a directional breakout could be very rapid.
Why is the detail of Kazuo Ueda's absence from the press conference so important?
Shinichi Uchida's past policy statements have leaned more hawkish, and his expression of tolerance for inflation risks has been more direct than Ueda's. The market is concerned that he might mention phrases such as "a faster pace of interest rate hikes" or "there should be no hesitation in reducing the balance sheet." Such unexpectedly hawkish communication would be extremely beneficial to the yen and impact long positions in USD/JPY.
What is the transmission chain between the decline in Japanese bond yields and the yen exchange rate?
A decline in Japanese bond yields means a decrease in the attractiveness of yen-denominated assets, which, from an interest rate differential perspective, would put downward pressure on the yen. However, if the decline in yields is due to a dovish stance from the Bank of Japan, it would put double pressure on the yen. A key indicator to watch is the real interest rate differential between the US and Japan's 10-year bonds; if this differential does not narrow significantly, the basis for the yen's continued appreciation is not solid.
The market logic is shifting from simple interest rate carry trades to a repricing of the supply and demand dynamics of Japanese government bonds. A well-known institution reported that the Bank of Japan may consider pausing its bond-buying program in fiscal year 2027, or even shifting to open-ended purchases. Following this news, the Japanese government bond yield curve flattened in a bullish manner: the 10-year yield fell 4.5 basis points to 2.635%, and the 30-year yield plummeted 6.5 basis points. This should have supported the yen through the narrowing interest rate differential, but the exchange rate reaction was muted. The market seems more concerned about another signal—whether pausing balance sheet reduction signifies a deeper concern by the central bank about runaway long-term interest rates.
From a price action perspective, the pullback after encountering resistance at the high of 160.59 was confirmed by a MACD death cross on the 240-minute chart. The DIFF fast line crossed below the DEA slow line, and the green histogram bars showed a moderate increase in volume, indicating short-term bearish momentum. The price is currently trading between the Bollinger Band middle line at 160.35 and the lower band at 160.02, closely following the middle line. Considering that the Bollinger Bands are generally narrowing and volatility has compressed to recent lows, this suggests that the energy for a breakout is accumulating, and a directional move is imminent.
How Japanese bond yields transmit to exchange rates: Implicit signals of a pause in quantitative tightening
Friday's behavior in the Japanese government bond market was itself a paradox. The decline in yields was ostensibly driven by safe-haven buying – following the US cancellation of its planned attack on Iran and falling oil prices suppressing inflation expectations – but the anomaly was that ultra-long-term yields fell far more sharply than short-term yields, with the 30-year yield dropping 6.5 basis points on the day.
This strong buying at the ultra-long end is directly related to news that the Bank of Japan may pause its bond-buying program. According to sources, even if the Bank of Japan stops actively reducing its balance sheet, of the approximately 530 trillion yen in government bonds held, nearly 50 trillion yen will naturally mature each year. Some policymakers believe that this passive balance sheet reduction is sufficient, and that forced active reduction could lead to insufficient market absorption capacity. This logic itself is favorable for the yen: if the central bank slows down tightening to ensure bond market stability, its policy rate normalization process will be more cautious. However, the market is clearly interpreting this in reverse—the pause in balance sheet reduction is seen as the central bank's tacit acceptance of Japan's high long-term interest rates, thus narrowing the space for a narrowing of the real interest rate differential between the US and Japan, which limits the extent to which the yen strengthens due to expectations of interest rate hikes.
The probability of the Bank of Japan raising interest rates by 25 basis points to 1% next Tuesday has already reached 97% in the overnight index swap market. This has already been fully priced in, explaining why the yen has been slow to react to expectations of a rate hike. The real focus of the game will be the subsequent press conference. Due to Kazuo Ueda's hospitalization for a liver cyst, Deputy Governor Shinichi Uchida will attend in his place. A trader from a Japanese brokerage firm is circulating in the market with the opinion that "Uchida's wording may be more hawkish than Ueda's." This expectation has not yet been fully priced in.
Support and resistance zones and key points to watch during trading.
The technical analysis framework is very clear, and fundamental events are filling in the driving logic for it.
Reference Contract: Spot USD/JPY
The upper resistance range is 160.35-160.59 (from the Bollinger Band middle line to yesterday's high).
The Bollinger Band middle line overlaps with short-term psychological resistance here. A successful breakout and hold above the middle line would indicate that the short-term pullback pressure has been released, at which point the bearish pressure from the MACD death cross would weaken. If the hourly chart shows repeated upper shadows in this range, we should be wary of momentum exhaustion.
Support zone below: 160.02-159.54 (lower Bollinger Band to Wednesday's pullback low).
If the price breaks below the lower Bollinger Band, the Bollinger Bands will narrow and then open downwards, establishing a short-term bearish structure. Technical selling pressure could push the price towards the recent pullback low of 159.54.
Key focus during the trading session: The movement of the Japanese government bond market in the Tokyo morning session is a key leading indicator. If ultra-long-term yields continue to decline rapidly, Japanese bank stocks may come under pressure, while USD/JPY often finds buying support during the Asian session. Conversely, if yields stabilize and rebound, it will suggest that market concerns about a pause in balance sheet reduction have eased, which is conducive to a technical rebound in the yen.
Future Trend Outlook
Over the next three trading days, USD/JPY will likely fluctuate within the narrowing range formed by the Bollinger Bands, but the Bank of Japan's decision next Tuesday will break this deadlock. A single 25 basis point rate hike is unlikely to sway a trend; the details of the quantitative tightening path are the key variable determining the direction. The current market consensus is that the Bank of Japan will convey a gradual and moderate normalization path. If the suspension of bond purchases is confirmed, it will effectively limit the upside potential of long-term Japanese government bond yields, thereby weakening the sustained buying interest in the yen due to the rate hike. Technically, if the price breaks through 160.59 effectively after the decision and continues to trade above the middle Bollinger Band, the medium-term upward structure will continue; conversely, if Shinichi Uchida's remarks indicate limited tolerance for inflation overshooting, coupled with maintaining the current pace of balance sheet reduction, USD/JPY may test the support level around 159.00.
Frequently Asked Questions
Why might the Bank of Japan's suspension of balance sheet reduction actually be detrimental to the strengthening of the yen?
A pause in balance sheet reduction is often interpreted by the market as a sign of central bank concerns about the stability of the bond market, which would limit the upside potential for long-term interest rates. Although short-term policy rates are rising, if long-term interest rates are kept under control, the narrowing of the US-Japan interest rate differential will be limited, which would weaken the fundamental support the yen has gained from interest rate hikes.
Why did the expectation of a 25 basis point interest rate hike by the Bank of Japan fail to boost the yen?
The overnight index swap market has already priced in as much as 97% of this rate hike, meaning the market has fully priced it in. When expectations are "realized" without any unexpected news, it often triggers "buy the rumor, sell the fact" trading behavior. Currently, the market's attention has shifted to the timing of the next rate hike and the details of balance sheet reduction.
What is the technical significance of the current sideways consolidation in USD/JPY?
On the 240-minute chart, the Bollinger Bands are narrowing, accompanied by a MACD death cross, a common consolidation pattern awaiting a breakout. The price action has been compressed to between 160.02 and 160.69, indicating a potential one-sided trend is brewing. This narrowing pattern typically doesn't last long, and given next week's fundamental impact, the momentum for a directional breakout could be very rapid.
Why is the detail of Kazuo Ueda's absence from the press conference so important?
Shinichi Uchida's past policy statements have leaned more hawkish, and his expression of tolerance for inflation risks has been more direct than Ueda's. The market is concerned that he might mention phrases such as "a faster pace of interest rate hikes" or "there should be no hesitation in reducing the balance sheet." Such unexpectedly hawkish communication would be extremely beneficial to the yen and impact long positions in USD/JPY.
What is the transmission chain between the decline in Japanese bond yields and the yen exchange rate?
A decline in Japanese bond yields means a decrease in the attractiveness of yen-denominated assets, which, from an interest rate differential perspective, would put downward pressure on the yen. However, if the decline in yields is due to a dovish stance from the Bank of Japan, it would put double pressure on the yen. A key indicator to watch is the real interest rate differential between the US and Japan's 10-year bonds; if this differential does not narrow significantly, the basis for the yen's continued appreciation is not solid.
- Risk Warning and Disclaimer
- The market involves risk, and trading may not be suitable for all investors. This article is for reference only and does not constitute personal investment advice, nor does it take into account certain users’ specific investment objectives, financial situation, or other needs. Any investment decisions made based on this information are at your own risk.