Behind the rebound in crude oil prices: the real forces suppressing oil prices are only just emerging?
2026-06-17 22:01:05
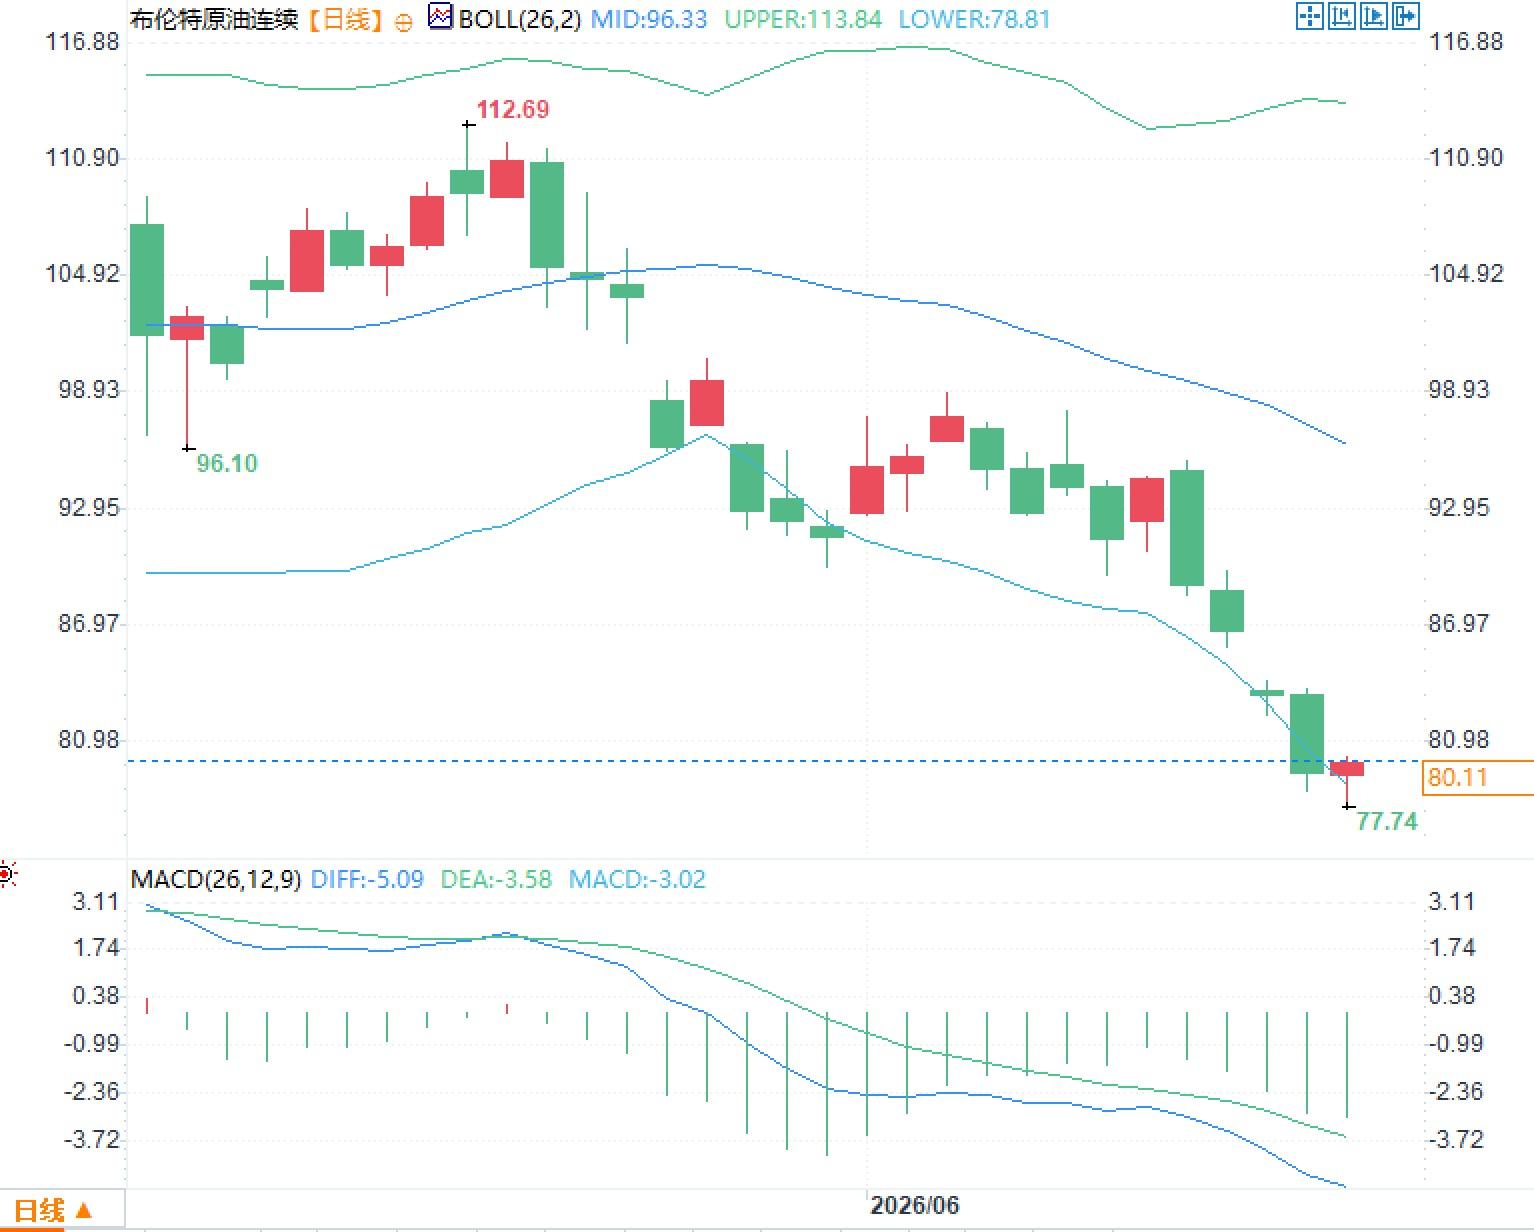
On Wednesday, June 17, the international crude oil market rebounded from its lows, but the price structure remained under pressure from expectations of ample supply. The US President stated that the understanding with Iran had not yet been finalized and warned that the US might resume military action if Iran failed to fulfill its conditions. This news briefly boosted risk premiums, with Brent crude trading around $80 per barrel, up about 1%, and West Texas Intermediate crude rising to $76.50 per barrel, up about 1.5%. However, both benchmark contracts recently hit their lowest levels since early March, indicating that market pricing focus has gradually shifted from immediate conflict risks to medium- to long-term supply glut.
This round of oil price rebound is primarily a correction of risk positions, rather than a substantial reversal in the supply-demand balance. Previously, the continuous decline in crude oil prices led to a rapid exit of some risk premiums, making market positions highly sensitive to any news that might affect passage through the Strait of Hormuz and Gulf exports. The latest statement from the US President increased uncertainty surrounding the understanding agreement, thus triggering short covering and short-term buying.
However, prices rebounded by only about 1% and remain near three-month lows, reflecting that traders did not equate these comments with another large-scale disruption to exports. The current temporary arrangement extends the ceasefire for 60 days, allowing time for further negotiations. As long as major shipping routes remain open and actual landed supply does not contract again, geopolitical risks are more likely to manifest as increased volatility rather than a sustained push for oil prices back to previous highs.

The market's current focus is not on the strength of the rhetoric, but rather on three verifiable variables: whether maritime transport volumes decline, whether export shipments are delayed, and whether the recovery of refinery and oilfield facilities stalls. Only if these physical flow indicators show a sustained deterioration will the risk premium potentially re-enter the longer-term price range.
The International Energy Agency's first-ever 2027 outlook indicates that global oil supply could increase by approximately 8 million barrels per day from current levels, while demand growth would be only about 2 million barrels per day, resulting in a supply-demand gap of 6 million barrels per day. After accounting for inventory repairs and regional capacity recovery, the potential supply surplus is estimated at approximately 5.05 million barrels per day.
This forecast implies that the market is facing not just cyclical inventory accumulation, but also the simultaneous occurrence of capacity recovery, project commissioning, and slowing demand growth. If production and exports in the Gulf region gradually return to normal, coupled with the release of new production in the Americas, the recovery on the supply side may be significantly faster than the improvement in end-consumer demand.
More importantly, expectations of oversupply will directly alter the forward curve. Near-month contracts may still be supported by transportation risks, refinery purchases, and seasonal demand, but forward prices need to factor in inventory capacity, floating storage costs, and hedging pressures on producers. If the market gradually forms a consensus on ample forward supply, a rebound in near-month contracts could easily be seen as a correction of risk premiums rather than the start of a new trend.
Data from the American Petroleum Institute (API) showed that U.S. crude oil inventories fell by approximately 8.3 million barrels in the week ending June 12, a significantly larger drop than the market's previous expectation of about 4.6 million barrels. The previous week, U.S. commercial crude oil inventories had already fallen by about 7.2 million barrels to 426.5 million barrels, about 5% lower than the five-year average for the same period.
Continued destocking suggests that refinery processing demand, export flows, or seasonal consumption continue to support the spot market, explaining the technical rebound in oil prices after a rapid decline. However, traders need to distinguish between declining commercial inventories and a tightening of global aggregate supply. A decrease in US inventories may stem from increased refinery utilization, decreased imports, or increased exports, and does not necessarily indicate a simultaneous strengthening of global demand.
If crude oil inventories decline while gasoline and distillate fuel inventories accumulate, the market will remain cautious about end-consumer demand. Conversely, if crude oil and major refined product inventories decline simultaneously, and crack spreads remain stable, the near-month structure may receive stronger support. Therefore, the total inventory level itself is insufficient; inventory composition and regional flow are more valuable for pricing.
The current crude oil market exhibits a significant maturity mismatch. In the short term, the recovery of some production, refining, and transportation facilities will take several weeks or even longer, and inventory levels will need to be replenished, meaning spot supply may not immediately become abundant. In the medium to long term, the return of substantial production capacity and limited demand growth make oversupply in 2027 a crucial variable suppressing valuations.
This means oil prices may remain highly volatile, but the sustainability of any upward movement depends on whether actual supply losses widen again. Risk news can drive intraday prices quickly, but it's unlikely to alter the annual balance sheet on its own. Compared to a single event headline, cross-regional export volumes, changes in commercial inventories, refinery utilization rates, shipping rates, and the shape of the forward curve are better indicators of whether the market is experiencing genuine tension or fluctuating risk sentiment.
This round of oil price rebound is primarily a correction of risk positions, rather than a substantial reversal in the supply-demand balance. Previously, the continuous decline in crude oil prices led to a rapid exit of some risk premiums, making market positions highly sensitive to any news that might affect passage through the Strait of Hormuz and Gulf exports. The latest statement from the US President increased uncertainty surrounding the understanding agreement, thus triggering short covering and short-term buying.
However, prices rebounded by only about 1% and remain near three-month lows, reflecting that traders did not equate these comments with another large-scale disruption to exports. The current temporary arrangement extends the ceasefire for 60 days, allowing time for further negotiations. As long as major shipping routes remain open and actual landed supply does not contract again, geopolitical risks are more likely to manifest as increased volatility rather than a sustained push for oil prices back to previous highs.
The market's current focus is not on the strength of the rhetoric, but rather on three verifiable variables: whether maritime transport volumes decline, whether export shipments are delayed, and whether the recovery of refinery and oilfield facilities stalls. Only if these physical flow indicators show a sustained deterioration will the risk premium potentially re-enter the longer-term price range.
The International Energy Agency's first-ever 2027 outlook indicates that global oil supply could increase by approximately 8 million barrels per day from current levels, while demand growth would be only about 2 million barrels per day, resulting in a supply-demand gap of 6 million barrels per day. After accounting for inventory repairs and regional capacity recovery, the potential supply surplus is estimated at approximately 5.05 million barrels per day.
This forecast implies that the market is facing not just cyclical inventory accumulation, but also the simultaneous occurrence of capacity recovery, project commissioning, and slowing demand growth. If production and exports in the Gulf region gradually return to normal, coupled with the release of new production in the Americas, the recovery on the supply side may be significantly faster than the improvement in end-consumer demand.
More importantly, expectations of oversupply will directly alter the forward curve. Near-month contracts may still be supported by transportation risks, refinery purchases, and seasonal demand, but forward prices need to factor in inventory capacity, floating storage costs, and hedging pressures on producers. If the market gradually forms a consensus on ample forward supply, a rebound in near-month contracts could easily be seen as a correction of risk premiums rather than the start of a new trend.
Data from the American Petroleum Institute (API) showed that U.S. crude oil inventories fell by approximately 8.3 million barrels in the week ending June 12, a significantly larger drop than the market's previous expectation of about 4.6 million barrels. The previous week, U.S. commercial crude oil inventories had already fallen by about 7.2 million barrels to 426.5 million barrels, about 5% lower than the five-year average for the same period.
Continued destocking suggests that refinery processing demand, export flows, or seasonal consumption continue to support the spot market, explaining the technical rebound in oil prices after a rapid decline. However, traders need to distinguish between declining commercial inventories and a tightening of global aggregate supply. A decrease in US inventories may stem from increased refinery utilization, decreased imports, or increased exports, and does not necessarily indicate a simultaneous strengthening of global demand.
If crude oil inventories decline while gasoline and distillate fuel inventories accumulate, the market will remain cautious about end-consumer demand. Conversely, if crude oil and major refined product inventories decline simultaneously, and crack spreads remain stable, the near-month structure may receive stronger support. Therefore, the total inventory level itself is insufficient; inventory composition and regional flow are more valuable for pricing.
The current crude oil market exhibits a significant maturity mismatch. In the short term, the recovery of some production, refining, and transportation facilities will take several weeks or even longer, and inventory levels will need to be replenished, meaning spot supply may not immediately become abundant. In the medium to long term, the return of substantial production capacity and limited demand growth make oversupply in 2027 a crucial variable suppressing valuations.
This means oil prices may remain highly volatile, but the sustainability of any upward movement depends on whether actual supply losses widen again. Risk news can drive intraday prices quickly, but it's unlikely to alter the annual balance sheet on its own. Compared to a single event headline, cross-regional export volumes, changes in commercial inventories, refinery utilization rates, shipping rates, and the shape of the forward curve are better indicators of whether the market is experiencing genuine tension or fluctuating risk sentiment.
- Risk Warning and Disclaimer
- The market involves risk, and trading may not be suitable for all investors. This article is for reference only and does not constitute personal investment advice, nor does it take into account certain users’ specific investment objectives, financial situation, or other needs. Any investment decisions made based on this information are at your own risk.