The first signs of oil and gas tankers have appeared in Hormuz; the real test for the energy market has only just begun.
2026-06-18 17:56:30
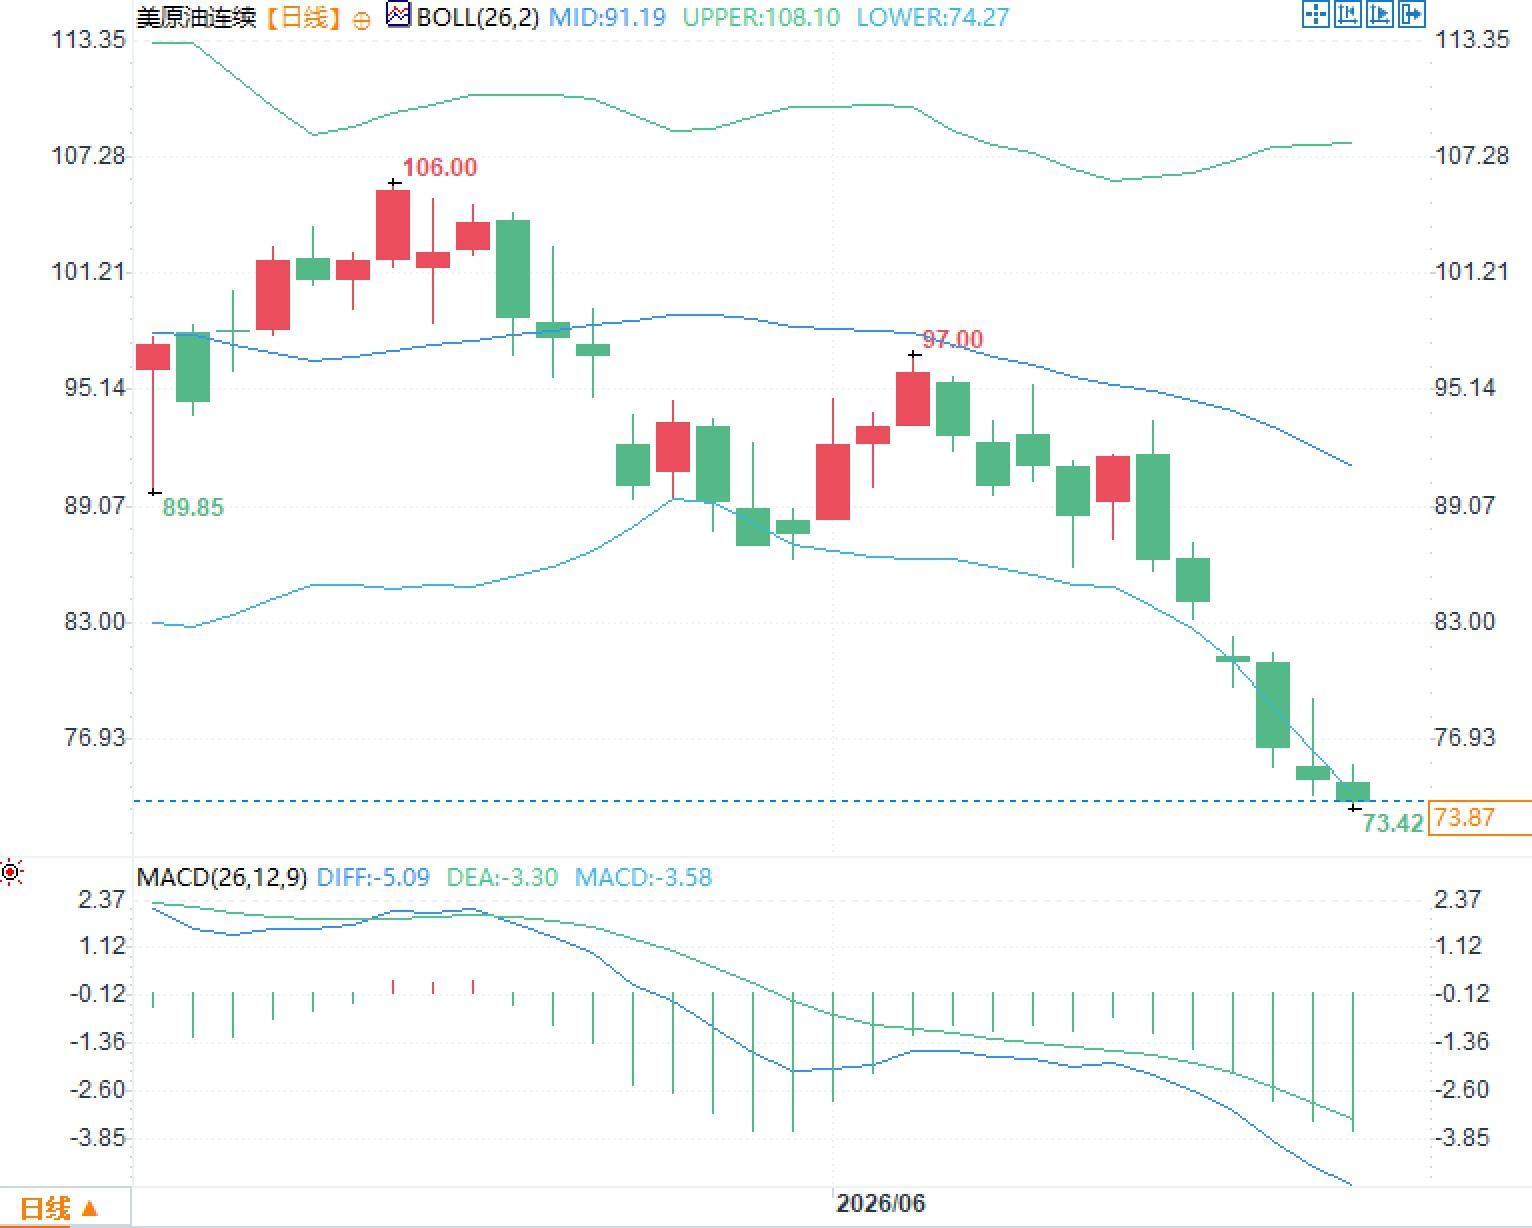
The first visible signs of the reopening of the Hormuz Passage are repricing risk premiums in the energy market. On Thursday, June 18, Brent crude fell to around $78 a barrel and West Texas Intermediate crude to around $74 a barrel, a significant drop from the highs driven by the passage closure. The market is not simply trading on the "peace dividend," but rather assessing three more pressing questions: whether shipowners are willing to resume dispatching vessels, whether insurance and freight rates will fall, and whether Qatari LNG and Gulf crude can transition from "case-by-case passage" to stable, bulk passage.
Ship tracking data shows that the LNG-laden vessel Mraikh and the empty product tanker Ye Chi entered the Strait of Hormuz and departed the Persian Gulf earlier on Thursday. Mraikh had previously loaded LNG in Qatar, with its destination listed as the port of Qasim in Pakistan. The latter's destination was not specified. Both vessels used a safe passage route approved by Tehran, indicating that the resumption of shipping remains heavily licensed rather than fully market-driven.
The nearly four-month shutdown had already altered traders' pricing models. Crude oil and liquefied natural gas are no longer solely judged by production and inventory; factors such as channel visibility, ship transponder status, insurance surcharges, port queue times, and shipowner risk appetite are also considered. The current decline in Brent crude from its previous highs to below $80 per barrel indicates that the market has already priced in some of the extreme scenario premiums, but this does not mean the energy curve has returned to its pre-conflict state.

For traders, the term structure is more crucial. If the near-month contract falls more than the far-month contract, it indicates that the market is digesting expectations of a short-term resumption of traffic. If subsequent spot loadings do not increase in tandem, near-month prices may regain support. Currently, prices are reacting too quickly, while the physical supply chain is reacting too slowly; this misalignment is the core source of future volatility.
Since the escalation of the US-Iran conflict in late February, the number of empty LNG carriers entering the Persian Gulf has been extremely low, meaning that "capacity availability" does not equate to "cargo availability." Mraikh's ability to sail out only proves that individual vessels can pass, not that the LNG export network has normalized. If the return of empty ships continues in the coming days, Qatar will face scheduling mismatches even with export capacity.
Pakistan is the most direct example to observe. The country relies heavily on Qatar for liquefied natural gas (LNG) imports, and its power generation system is also highly dependent on imported gas. If Mraikh arrives smoothly at Qasim port, it will alleviate short-term fuel shortages and may influence whether local temporary procurement tenders are cancelled. However, this is more like a temporary relief from a single shipment than a reversal of the supply-demand balance. Whether Asian buyers subsequently rearrange their procurement schedules will determine whether regional spot gas prices can continue to cool down.
This explains why there were still relatively few vessels passing through early Thursday morning. The passage of a small number of small cargo ships and individual oil and gas tankers does not indicate that major shipowners have lifted their risk controls. In recent months, some vessels have completed limited transport by turning off their transponders or applying for special permits. This pattern has increased market opacity and made it more difficult for traders to determine the true inventory levels and floating storage at sea.
If large LNG carriers, very large crude carriers (VLCCs), and product tankers gradually resume visible navigation in the coming week, insurance rates and freight rates may enter a downward trend. Conversely, if ships continue to pass through in a sporadic manner, oil prices may fall before fundamentals materialize, and subsequent volatility will be amplified.
This means prices will be less sensitive to new information and more sensitive to high-frequency physical data. The number of ships entering and leaving the Persian Gulf, the pace of Qatari loading, Pakistani cargo receipt status, insurance quotes, and shipping wait times will be more explanatory than verbal statements. If these indicators improve simultaneously, the risk premium for energy prices will continue to shrink. If discrepancies arise in implementation, the oil and gas market may re-trade supply uncertainty.
It's important to note that falling oil prices do not necessarily indicate weakening demand, nor do they necessarily signify a full recovery in supply. A more plausible explanation at present is the repricing of geopolitical transportation risks. For macro assets, lower energy costs will alleviate some inflationary pressures, but with shipping chains not yet fully restored, central banks and commodity markets will not immediately interpret this change as a definitive signal.
Ship tracking data shows that the LNG-laden vessel Mraikh and the empty product tanker Ye Chi entered the Strait of Hormuz and departed the Persian Gulf earlier on Thursday. Mraikh had previously loaded LNG in Qatar, with its destination listed as the port of Qasim in Pakistan. The latter's destination was not specified. Both vessels used a safe passage route approved by Tehran, indicating that the resumption of shipping remains heavily licensed rather than fully market-driven.
The nearly four-month shutdown had already altered traders' pricing models. Crude oil and liquefied natural gas are no longer solely judged by production and inventory; factors such as channel visibility, ship transponder status, insurance surcharges, port queue times, and shipowner risk appetite are also considered. The current decline in Brent crude from its previous highs to below $80 per barrel indicates that the market has already priced in some of the extreme scenario premiums, but this does not mean the energy curve has returned to its pre-conflict state.
For traders, the term structure is more crucial. If the near-month contract falls more than the far-month contract, it indicates that the market is digesting expectations of a short-term resumption of traffic. If subsequent spot loadings do not increase in tandem, near-month prices may regain support. Currently, prices are reacting too quickly, while the physical supply chain is reacting too slowly; this misalignment is the core source of future volatility.
Since the escalation of the US-Iran conflict in late February, the number of empty LNG carriers entering the Persian Gulf has been extremely low, meaning that "capacity availability" does not equate to "cargo availability." Mraikh's ability to sail out only proves that individual vessels can pass, not that the LNG export network has normalized. If the return of empty ships continues in the coming days, Qatar will face scheduling mismatches even with export capacity.
Pakistan is the most direct example to observe. The country relies heavily on Qatar for liquefied natural gas (LNG) imports, and its power generation system is also highly dependent on imported gas. If Mraikh arrives smoothly at Qasim port, it will alleviate short-term fuel shortages and may influence whether local temporary procurement tenders are cancelled. However, this is more like a temporary relief from a single shipment than a reversal of the supply-demand balance. Whether Asian buyers subsequently rearrange their procurement schedules will determine whether regional spot gas prices can continue to cool down.
This explains why there were still relatively few vessels passing through early Thursday morning. The passage of a small number of small cargo ships and individual oil and gas tankers does not indicate that major shipowners have lifted their risk controls. In recent months, some vessels have completed limited transport by turning off their transponders or applying for special permits. This pattern has increased market opacity and made it more difficult for traders to determine the true inventory levels and floating storage at sea.
If large LNG carriers, very large crude carriers (VLCCs), and product tankers gradually resume visible navigation in the coming week, insurance rates and freight rates may enter a downward trend. Conversely, if ships continue to pass through in a sporadic manner, oil prices may fall before fundamentals materialize, and subsequent volatility will be amplified.
This means prices will be less sensitive to new information and more sensitive to high-frequency physical data. The number of ships entering and leaving the Persian Gulf, the pace of Qatari loading, Pakistani cargo receipt status, insurance quotes, and shipping wait times will be more explanatory than verbal statements. If these indicators improve simultaneously, the risk premium for energy prices will continue to shrink. If discrepancies arise in implementation, the oil and gas market may re-trade supply uncertainty.
It's important to note that falling oil prices do not necessarily indicate weakening demand, nor do they necessarily signify a full recovery in supply. A more plausible explanation at present is the repricing of geopolitical transportation risks. For macro assets, lower energy costs will alleviate some inflationary pressures, but with shipping chains not yet fully restored, central banks and commodity markets will not immediately interpret this change as a definitive signal.
- Risk Warning and Disclaimer
- The market involves risk, and trading may not be suitable for all investors. This article is for reference only and does not constitute personal investment advice, nor does it take into account certain users’ specific investment objectives, financial situation, or other needs. Any investment decisions made based on this information are at your own risk.