A ship was hit, but the market chose to continue selling crude oil.
2026-06-26 20:32:35
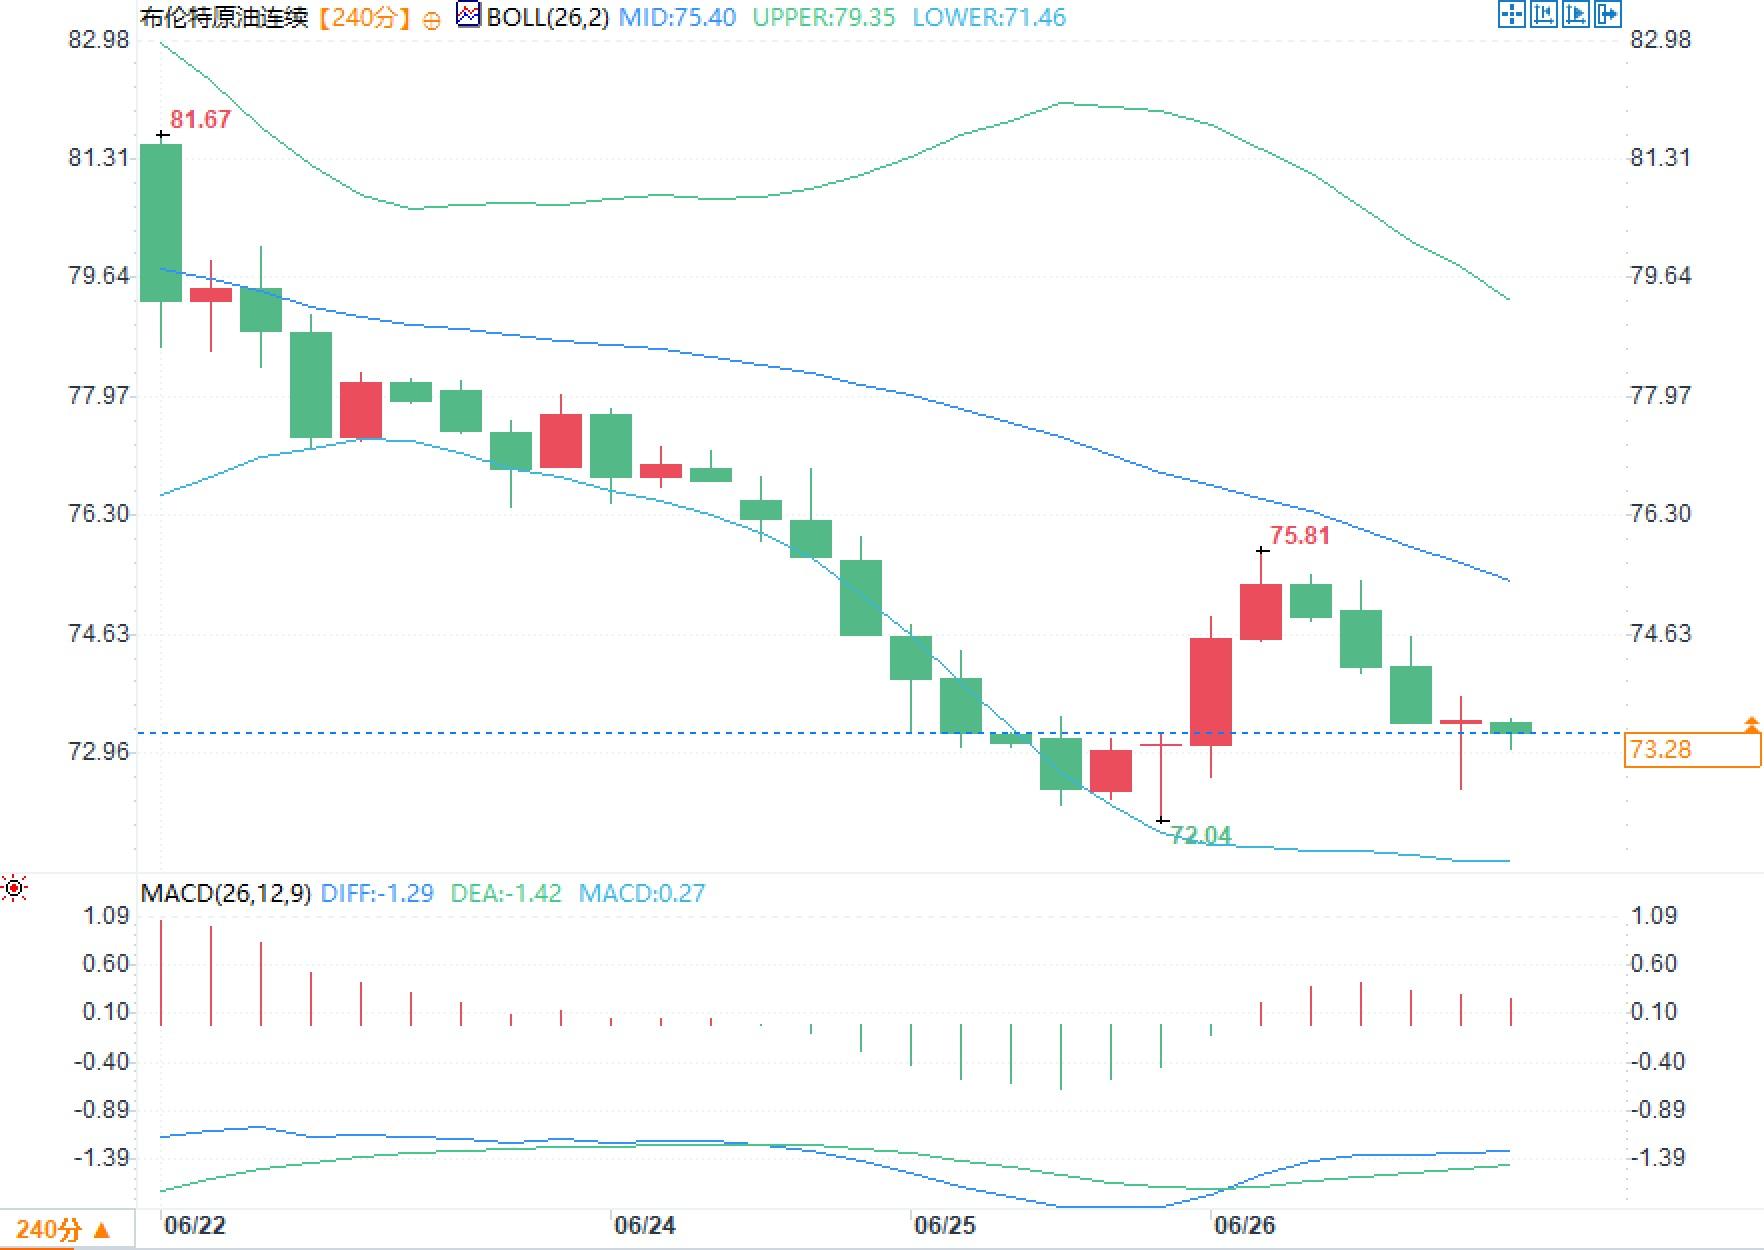
On Friday, June 26th, the core issue in the energy market wasn't the attack on a container ship itself, but rather whether the Hormuz passage rules would shift from a temporary reinstatement to long-term uncertainty. Currently, Brent crude has fallen to around $73 per barrel, and WTI crude to around $70 per barrel, both down approximately 21% this month. This indicates that the market is rapidly squeezing out the premium from previous conflict risks, but it doesn't mean the risks have disappeared. What's more noteworthy now is the changing pattern of risk premiums; prices are no longer simply trading on lockdown panic, but rather on route selection, insurance rates, shipping delays, inventory rebuilding, and refinery restocking pace.
Recent ship attacks occurred near the relatively safe southern shipping lanes, which, logically, should have pushed up short-term risk premiums. However, oil prices have instead declined. The key reason is that more oil tankers are still leaving the Gulf, indicating that there has been no systemic disruption to physical cargo flows. Ship tracking information shows that fully loaded tankers continue to head towards exports, while empty large tankers are waiting to load cargo off the coast of Oman. This sends a clear signal to the market that traffic is not completely frozen.
However, this is not simply a negative factor. The market pullback is based on expectations of traffic recovery. If actual traffic volume cannot be sustained, the low-level risk premium may be repriced. Previously, the daily merchant ship traffic through the strait was around 100 vessels. Although it has recovered recently, it is still below normal levels. In other words, the price decline reflects marginal improvement, not complete normalization. The current sluggish response of oil prices to a single attack indicates that the market is focusing on continuous traffic flow rather than isolated events.
The Strait of Hormuz influences commodities not because of its geographical location, but because it directly links to spot market liquidity. Verifiable data shows that in the first half of 2025, approximately 20.9 million barrels per day of oil products flowed through this strait, including about 14.7 million barrels per day of crude oil and condensate, and about 6.1 million barrels per day of refined products. In 2024, about 20% of global liquefied natural gas (LNG) trade also passed through this strait, with Qatar exporting approximately 9.3 billion cubic feet per day and the UAE exporting approximately 700 million cubic feet per day.
This means that the market truly prices three chains of factors. First, the pace of crude oil loading and unloading determines whether spot premiums/discounts will continue to decline. Second, long-term LNG contract deliveries and spot shipping schedules determine the risk margin for gas prices in Europe and Northeast Asia. Third, insurance and freight costs; if shipowners demand additional risk compensation, even if oil prices fall, actual landed costs may decline with a lag. For refineries, a decline in book crude oil prices does not equate to a simultaneous decrease in procurement costs; shipping costs and delivery reliability are also factored into the crack spread model.
The latest monthly report in June revised its 2026 global oil demand forecast to a year-on-year decline of 1.1 million barrels per day, while supply is projected to fall to 102.4 million barrels per day, and refinery crude oil processing volumes are expected to decrease by 2 million barrels per day to 82 million barrels per day. This data indicates that the market has shifted from a focus on "whether supply will break down" to "how to repair inventory." Previously high oil prices, shipping disruptions, and reduced product availability suppressed end-user demand; however, the rapid price decline after traffic resumed will force the spot market to reassess the intensity of restocking.
More complexly, a decline in crude oil prices may not simultaneously suppress volatility in refined product prices. Summer travel demand, refinery operating constraints, and low regional inventories could all help maintain the resilience of gasoline, diesel, and jet fuel crack spreads. If crude oil prices are pressured by concentrated tanker departures, while refined product prices remain firm due to refinery instability, the energy curve will exhibit a structure of weak crude oil and strong refined products. Under this structure, macroeconomic trading may appear to be less risky, but pricing within the industry chain will remain highly volatile.
Interest rates also limited the upside potential for oil prices. The Federal Reserve maintained its target range for the federal funds rate at 3.50% to 3.75% in June, while emphasizing that inflation remained above its 2% target. The European Central Bank raised interest rates by 25 basis points in June, increasing its deposit rate to 2.25%. A renewed rise in energy prices would reinforce central banks' concerns about a second wave of inflation; a continued decline in energy prices would help suppress inflation expectations, but could also reflect insufficient resilience on the demand side. Current oil prices are not solely driven by supply, but are the result of a combination of factors: supply recovery, weakening demand, and policy interest rate constraints.
- Risk Warning and Disclaimer
- The market involves risk, and trading may not be suitable for all investors. This article is for reference only and does not constitute personal investment advice, nor does it take into account certain users’ specific investment objectives, financial situation, or other needs. Any investment decisions made based on this information are at your own risk.