As LME aluminum tested the $3034 level, a $5.6 billion deal revealed the true nature of copper.
2026-07-01 20:12:57
On Wednesday (July 1st), LME aluminum and copper continued to face downward pressure, but a key industry asset divestiture news created a significant difference in the fundamental logic of the two metals. Aluminum prices maintained their downward trend, approaching key support levels; copper prices, on the other hand, showed signs of stabilizing after hitting a recent low. Market attention quickly shifted to the long-term direction implied by this structural change: aluminum assets are being actively scaled back by major players, while the strategic importance of copper is further highlighted.

On the same day, a major transaction was announced: a global mining company sold all of its aluminum assets in Australia, Brazil, and South Africa to an aluminum giant for up to $5.6 billion in enterprise value, shifting its focus to a more concentrated asset portfolio centered on metals such as copper and zinc. This transaction is expected to bring considerable synergies, with the buyer gaining both geographical and scale expansion. The seller had previously divested its coal, nickel, and smelting businesses; this sale of aluminum assets means a reduction of approximately 40% of its EBITDA. However, the departure of the low-growth business will significantly increase copper's contribution to production to around 55%, and the underlying EBITDA margin is expected to double to 50%, placing it on par with top mining giants. Market commentators generally believe this is a proactive move to remove a "poison pill." The low-growth aluminum business, with limited potential buyers, has long constrained the company's valuation; what remains is an asset portfolio highly concentrated in energy transition and key metals for AI, and due to limited production but clear demand growth, it is becoming a potential acquisition target. Following the announcement, the company's stock price surged, reflecting a reassessment of the attractiveness of copper assets, while aluminum faces outflow pressure in terms of capital allocation.
At the macro level, weak global manufacturing data coupled with repeated tariff rhetoric continues to weigh on industrial metals. However, aluminum faces a more complex situation: the withdrawal of large miners suggests that industrial capital is becoming more conservative in pricing aluminum for long-term growth; copper, on the other hand, benefits from structural demand support brought about by electrification and the expansion of AI computing power. This fundamental divergence is directly reflected in the intraday market, with aluminum prices testing lower levels and copper prices consolidating at lower levels, indicating a reduced correlation.
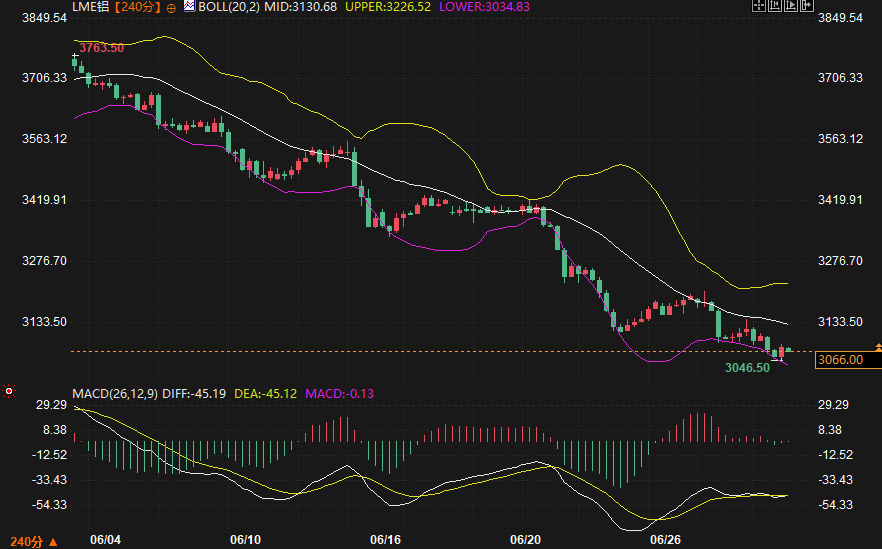
The 240-minute chart for LME aluminum (March contract) shows a smooth decline from the previous high of 3763.50, currently trading close to the lower Bollinger Band at 3034.83, having broken below the middle band at 3130.68, clearly indicating a weak market. The MACD lines are below the zero line, with the DIFF slightly below the DEA and the histogram close to the zero line, suggesting weakening downward momentum, but the bulls have not yet organized an effective resistance. The key support zone below is the psychological level of 3034-3000, which also represents the lower edge of previous densely traded areas; failure to hold this level could trigger a move towards lower levels. The first resistance level to watch is the middle Bollinger Band at 3130; a successful recovery above this level would alleviate downward pressure.
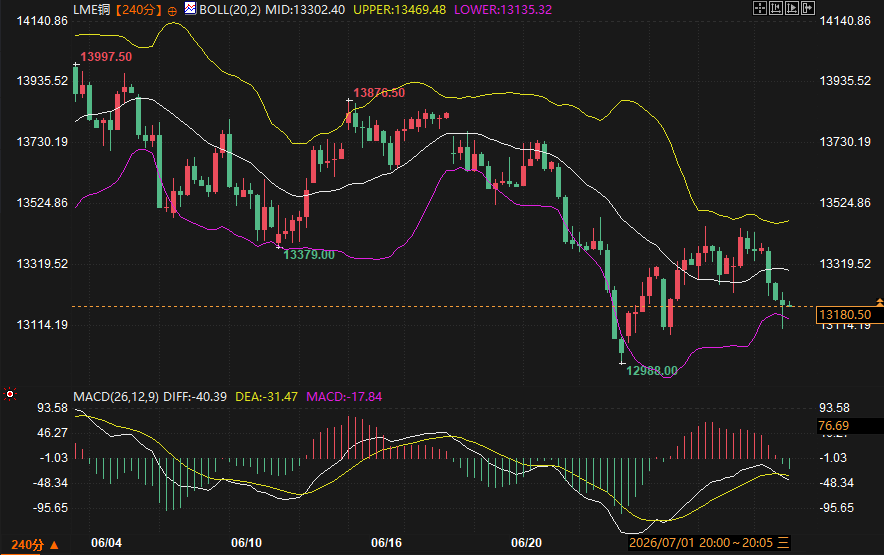
LME copper (3-month contract) stabilized after falling from a low of 12988.00 to 13997.50, currently trading at 13180.50, slightly above the lower Bollinger Band at 13135.32, but still under pressure from the middle Bollinger Band at 13302.40. The MACD lines are below the zero line, but the green histogram has narrowed significantly compared to the previous period. The DIFF line and price have not simultaneously reached new lows, suggesting an attempt to form a bullish divergence. Key support levels are the lower Bollinger Band at 13135 and the previous low of 12988; a break below these levels would initiate a new phase of decline. Resistance is seen at the middle Bollinger Band at 13302; a break above this level requires significant volume support and is a key intraday point to watch for the continuation of the rebound.
In summary, both aluminum and copper are in a downtrend, but driven by different factors. Aluminum's decline has been smooth and lacks fundamental support, while copper shows signs of oversold correction at lower levels. If both break down simultaneously, the downtrend will intensify; if copper recovers its middle Bollinger Band first while aluminum holds its lower band, the divergence between the two will further widen.
In the short term, aluminum prices lack fundamental buying momentum amid industry giants withdrawing from aluminum assets. The support level around 3034 (lower Bollinger Band) is crucial; a break below this level would open up further downside potential. Copper, while still suppressed by macroeconomic risk aversion, possesses long-term value revealed by strategic mergers and acquisitions, giving it the potential for a rebound from oversold levels. Technically, attention should be paid to whether a bullish divergence can be successfully formed and drive a return to the middle Bollinger Band. However, if macroeconomic risk aversion continues to escalate, both copper and aluminum still face the risk of a synchronized downward move, requiring continuous assessment based on market fear indicators.
Why will this sale of aluminum assets exacerbate the divergence between aluminum and copper?
This transaction clearly indicates that major mining companies are positioning aluminum as a low-growth, non-core asset, while shifting their capital and strategic focus to copper. This means that industrial capital's long-term valuation support for aluminum is weakening, while the scarcity and demand prospects of copper assets are being repriced, thus triggering a shift in the relative strength of the two commodities in the market.
After LME aluminum broke below the Bollinger Middle Band, how should we observe the downside potential?
The current lower Bollinger Band at 3034 is the first technical line of defense, coinciding with a previous area of high trading volume. If this level is breached, the psychological level of $3000 will be tested. Note that the MACD histogram is near the zero line; after the selling pressure subsides, intraday fluctuations are possible. Pay attention to the candlestick patterns near the lower Bollinger Band, where bulls and bears are locked in a struggle.
Does the narrowing of the MACD histogram in LME copper, coupled with the fact that the price has not made a new low with the indicator, signify a confirmed bottom?
This only indicates a weakening of bearish momentum, a normal phenomenon in the process of bottom divergence formation, and is not sufficient evidence of a trend reversal. We need to wait for the price to rebound strongly above the 13302 mid-line, driving the DIFF line to cross above the DEA line, to increase the probability of a bottom forming in this phase.
How should we view the recent weakening of the correlation between aluminum and copper prices?
Both aluminum and copper are industrial metals, and a decrease in their correlation often indicates a shift in the driving logic from common macroeconomic factors to the fundamentals of the individual commodities. The current situation of weak aluminum and stable copper reflects a redistribution of long-term structural pricing for these two commodities by industrial capital. Traders can use this to observe the market's shift in preference between "old energy and old infrastructure" and "newly transformed metals."
How will South32's divestment of its aluminum business to focus on copper affect the long-term supply and demand pattern of copper?
While the transaction itself does not change the immediate copper mine supply, it serves as a sign of a strategic shift by mining giants, foreshadowing potentially intensified mergers and acquisitions and resource competition within the industry. The concentration and "irreplaceability" of high-quality copper assets, coupled with limited new mine additions, reinforces expectations of long-term supply tightness and supports the forward pricing range.
Fundamental divergence: Aluminum assets sold off, copper becomes core to transformation
On the same day, a major transaction was announced: a global mining company sold all of its aluminum assets in Australia, Brazil, and South Africa to an aluminum giant for up to $5.6 billion in enterprise value, shifting its focus to a more concentrated asset portfolio centered on metals such as copper and zinc. This transaction is expected to bring considerable synergies, with the buyer gaining both geographical and scale expansion. The seller had previously divested its coal, nickel, and smelting businesses; this sale of aluminum assets means a reduction of approximately 40% of its EBITDA. However, the departure of the low-growth business will significantly increase copper's contribution to production to around 55%, and the underlying EBITDA margin is expected to double to 50%, placing it on par with top mining giants. Market commentators generally believe this is a proactive move to remove a "poison pill." The low-growth aluminum business, with limited potential buyers, has long constrained the company's valuation; what remains is an asset portfolio highly concentrated in energy transition and key metals for AI, and due to limited production but clear demand growth, it is becoming a potential acquisition target. Following the announcement, the company's stock price surged, reflecting a reassessment of the attractiveness of copper assets, while aluminum faces outflow pressure in terms of capital allocation.
At the macro level, weak global manufacturing data coupled with repeated tariff rhetoric continues to weigh on industrial metals. However, aluminum faces a more complex situation: the withdrawal of large miners suggests that industrial capital is becoming more conservative in pricing aluminum for long-term growth; copper, on the other hand, benefits from structural demand support brought about by electrification and the expansion of AI computing power. This fundamental divergence is directly reflected in the intraday market, with aluminum prices testing lower levels and copper prices consolidating at lower levels, indicating a reduced correlation.
Technical correlation analysis and key range
The 240-minute chart for LME aluminum (March contract) shows a smooth decline from the previous high of 3763.50, currently trading close to the lower Bollinger Band at 3034.83, having broken below the middle band at 3130.68, clearly indicating a weak market. The MACD lines are below the zero line, with the DIFF slightly below the DEA and the histogram close to the zero line, suggesting weakening downward momentum, but the bulls have not yet organized an effective resistance. The key support zone below is the psychological level of 3034-3000, which also represents the lower edge of previous densely traded areas; failure to hold this level could trigger a move towards lower levels. The first resistance level to watch is the middle Bollinger Band at 3130; a successful recovery above this level would alleviate downward pressure.
LME copper (3-month contract) stabilized after falling from a low of 12988.00 to 13997.50, currently trading at 13180.50, slightly above the lower Bollinger Band at 13135.32, but still under pressure from the middle Bollinger Band at 13302.40. The MACD lines are below the zero line, but the green histogram has narrowed significantly compared to the previous period. The DIFF line and price have not simultaneously reached new lows, suggesting an attempt to form a bullish divergence. Key support levels are the lower Bollinger Band at 13135 and the previous low of 12988; a break below these levels would initiate a new phase of decline. Resistance is seen at the middle Bollinger Band at 13302; a break above this level requires significant volume support and is a key intraday point to watch for the continuation of the rebound.
In summary, both aluminum and copper are in a downtrend, but driven by different factors. Aluminum's decline has been smooth and lacks fundamental support, while copper shows signs of oversold correction at lower levels. If both break down simultaneously, the downtrend will intensify; if copper recovers its middle Bollinger Band first while aluminum holds its lower band, the divergence between the two will further widen.
Future Trend Outlook
In the short term, aluminum prices lack fundamental buying momentum amid industry giants withdrawing from aluminum assets. The support level around 3034 (lower Bollinger Band) is crucial; a break below this level would open up further downside potential. Copper, while still suppressed by macroeconomic risk aversion, possesses long-term value revealed by strategic mergers and acquisitions, giving it the potential for a rebound from oversold levels. Technically, attention should be paid to whether a bullish divergence can be successfully formed and drive a return to the middle Bollinger Band. However, if macroeconomic risk aversion continues to escalate, both copper and aluminum still face the risk of a synchronized downward move, requiring continuous assessment based on market fear indicators.
Frequently Asked Questions
Why will this sale of aluminum assets exacerbate the divergence between aluminum and copper?
This transaction clearly indicates that major mining companies are positioning aluminum as a low-growth, non-core asset, while shifting their capital and strategic focus to copper. This means that industrial capital's long-term valuation support for aluminum is weakening, while the scarcity and demand prospects of copper assets are being repriced, thus triggering a shift in the relative strength of the two commodities in the market.
After LME aluminum broke below the Bollinger Middle Band, how should we observe the downside potential?
The current lower Bollinger Band at 3034 is the first technical line of defense, coinciding with a previous area of high trading volume. If this level is breached, the psychological level of $3000 will be tested. Note that the MACD histogram is near the zero line; after the selling pressure subsides, intraday fluctuations are possible. Pay attention to the candlestick patterns near the lower Bollinger Band, where bulls and bears are locked in a struggle.
Does the narrowing of the MACD histogram in LME copper, coupled with the fact that the price has not made a new low with the indicator, signify a confirmed bottom?
This only indicates a weakening of bearish momentum, a normal phenomenon in the process of bottom divergence formation, and is not sufficient evidence of a trend reversal. We need to wait for the price to rebound strongly above the 13302 mid-line, driving the DIFF line to cross above the DEA line, to increase the probability of a bottom forming in this phase.
How should we view the recent weakening of the correlation between aluminum and copper prices?
Both aluminum and copper are industrial metals, and a decrease in their correlation often indicates a shift in the driving logic from common macroeconomic factors to the fundamentals of the individual commodities. The current situation of weak aluminum and stable copper reflects a redistribution of long-term structural pricing for these two commodities by industrial capital. Traders can use this to observe the market's shift in preference between "old energy and old infrastructure" and "newly transformed metals."
How will South32's divestment of its aluminum business to focus on copper affect the long-term supply and demand pattern of copper?
While the transaction itself does not change the immediate copper mine supply, it serves as a sign of a strategic shift by mining giants, foreshadowing potentially intensified mergers and acquisitions and resource competition within the industry. The concentration and "irreplaceability" of high-quality copper assets, coupled with limited new mine additions, reinforces expectations of long-term supply tightness and supports the forward pricing range.
- Risk Warning and Disclaimer
- The market involves risk, and trading may not be suitable for all investors. This article is for reference only and does not constitute personal investment advice, nor does it take into account certain users’ specific investment objectives, financial situation, or other needs. Any investment decisions made based on this information are at your own risk.