30% probability of a July rate hike: Will tonight's non-farm payrolls report be "fuel" or "fire extinguisher"?
2026-07-02 11:24:21
On Thursday (July 2) during the Asian session, the US dollar index fluctuated at high levels and is currently trading around 101.35.
The market is pricing in the possibility of a Fed rate hike in the third quarter, which, although unlikely, is a real possibility.
The June non-farm payrolls report, to be released Thursday evening, will be a key variable in verifying this expectation.

The market generally expects June nonfarm payrolls to increase by 114,000 jobs, with average hourly earnings rising 0.3% month-on-month (3.5% year-on-year), and the unemployment rate remaining at 4.3%. So far this year, the nonfarm payroll report has been generally robust—exceeding expectations in four of the first five months, with an average monthly increase of about 82,000 jobs.
Against this backdrop, traders generally expect this month's data to maintain a stable tone: moderate job growth, a stable unemployment rate, and gradual wage increases.
With inflation persisting above the Fed's 2% target, coupled with Warsh's hawkish tone at the first FOMC meeting, the market is pricing in the possibility of a Fed rate hike as early as this month. The CME FedWatch tool indicates a roughly 30% probability of a rate hike in July.
This month's non-farm payroll forecast faces a unique challenge—the ISM Services PMI will be released after the non-farm payroll data, therefore it cannot be included in forward-looking models. Currently, the following four leading indicators are available for reference:
The ISM Manufacturing Employment Index rose from 48.6 to 49.7, approaching the 50-point mark separating expansion from contraction, indicating that the contraction in manufacturing employment has narrowed.
ADP Employment Report: 98,000 new jobs were added in June, lower than the previous month's 122,000.
The four-week moving average of initial jobless claims rose to $224,000, up from $215,000 the previous month.
Based on the above data and internal model calculations, leading indicators suggest that this month's non-farm payrolls may be higher than expected, with new jobs likely falling between 125,000 and 175,000. However, it is important to emphasize that due to limited survey response rates, the forecast has a large margin of uncertainty, and monthly fluctuations are inherently difficult to predict accurately—any forecast (including ours) should not be over-interpreted. Other sub-data such as wage growth and the unemployment rate will also influence market reactions.
From the daily chart, the US dollar index has confirmed a medium-term bullish trend, and its current position is near a 14-month high. The breakout of the technical structure opens up room for further upward movement.
If the non-farm payroll data exceeds expectations, the market will seriously price in a rate hike in the third quarter, and the US dollar index is expected to continue its upward trend, with the next target around the May 2025 high of 102.00.
If employment data is weak, expectations of interest rate hikes will be delayed, putting short-term pressure on the US dollar.
(US Dollar Index Daily Chart, Source: FX678)
Tonight's non-farm payroll report is significant beyond a single data point—it's the first real-world test of Walsh's "data-driven" decision-making framework. Three scenarios correspond to three market paths:
Strong data (above 175,000): The probability of a rate hike in July will increase significantly, and the US dollar index is expected to reach 102.00.
Data met expectations (110,000-150,000): The market maintained its current pricing, and the US dollar consolidated within the range after the breakout.
Weak data (below 110,000): Rate hike expectations have faded, the dollar has pulled back in the short term, but the medium-term structure remains intact.
At 11:23 AM Beijing time on July 2, the US dollar index was at 101.38.
The market is pricing in the possibility of a Fed rate hike in the third quarter, which, although unlikely, is a real possibility.
The June non-farm payrolls report, to be released Thursday evening, will be a key variable in verifying this expectation.
Non-farm payroll report expectations overview
The market generally expects June nonfarm payrolls to increase by 114,000 jobs, with average hourly earnings rising 0.3% month-on-month (3.5% year-on-year), and the unemployment rate remaining at 4.3%. So far this year, the nonfarm payroll report has been generally robust—exceeding expectations in four of the first five months, with an average monthly increase of about 82,000 jobs.
Against this backdrop, traders generally expect this month's data to maintain a stable tone: moderate job growth, a stable unemployment rate, and gradual wage increases.
With inflation persisting above the Fed's 2% target, coupled with Warsh's hawkish tone at the first FOMC meeting, the market is pricing in the possibility of a Fed rate hike as early as this month. The CME FedWatch tool indicates a roughly 30% probability of a rate hike in July.
Leading indicators: pointing to a bullish bias, but uncertainty remains high.
This month's non-farm payroll forecast faces a unique challenge—the ISM Services PMI will be released after the non-farm payroll data, therefore it cannot be included in forward-looking models. Currently, the following four leading indicators are available for reference:
The ISM Manufacturing Employment Index rose from 48.6 to 49.7, approaching the 50-point mark separating expansion from contraction, indicating that the contraction in manufacturing employment has narrowed.
ADP Employment Report: 98,000 new jobs were added in June, lower than the previous month's 122,000.
The four-week moving average of initial jobless claims rose to $224,000, up from $215,000 the previous month.
Based on the above data and internal model calculations, leading indicators suggest that this month's non-farm payrolls may be higher than expected, with new jobs likely falling between 125,000 and 175,000. However, it is important to emphasize that due to limited survey response rates, the forecast has a large margin of uncertainty, and monthly fluctuations are inherently difficult to predict accurately—any forecast (including ours) should not be over-interpreted. Other sub-data such as wage growth and the unemployment rate will also influence market reactions.
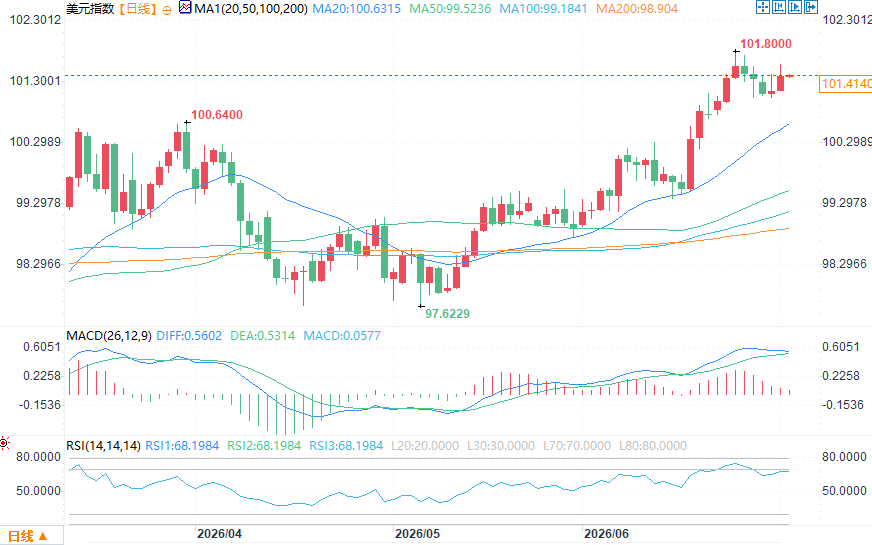
US Dollar Index Technical Analysis: Breakout Confirmed, Data to Determine Next Move
From the daily chart, the US dollar index has confirmed a medium-term bullish trend, and its current position is near a 14-month high. The breakout of the technical structure opens up room for further upward movement.
If the non-farm payroll data exceeds expectations, the market will seriously price in a rate hike in the third quarter, and the US dollar index is expected to continue its upward trend, with the next target around the May 2025 high of 102.00.
If employment data is weak, expectations of interest rate hikes will be delayed, putting short-term pressure on the US dollar.
(US Dollar Index Daily Chart, Source: FX678)
Summary: Data sets the tone; three scenarios, three approaches.
Tonight's non-farm payroll report is significant beyond a single data point—it's the first real-world test of Walsh's "data-driven" decision-making framework. Three scenarios correspond to three market paths:
Strong data (above 175,000): The probability of a rate hike in July will increase significantly, and the US dollar index is expected to reach 102.00.
Data met expectations (110,000-150,000): The market maintained its current pricing, and the US dollar consolidated within the range after the breakout.
Weak data (below 110,000): Rate hike expectations have faded, the dollar has pulled back in the short term, but the medium-term structure remains intact.
At 11:23 AM Beijing time on July 2, the US dollar index was at 101.38.
- Risk Warning and Disclaimer
- The market involves risk, and trading may not be suitable for all investors. This article is for reference only and does not constitute personal investment advice, nor does it take into account certain users’ specific investment objectives, financial situation, or other needs. Any investment decisions made based on this information are at your own risk.