Non-Farm Payrolls Preview: 68 Indicators Reveal the US Job Market, with a 0.76% Bullish/Bearish Ratio for Gold.
2026-07-02 15:03:56
One chart: 25 out of 68 US employment-related indicators are bullish for gold. The latest US non-farm payroll data will be released on July 2, 2026 at 20:30; the market is paying close attention.
The US non-farm payrolls report, considered a must-see in financial markets, will likely impact the market. The answer will be revealed tonight. This article features original charts that may offer a glimpse into the impact.
The table shows 25 bullish indicators and 33 bearish indicators for gold, with 10 having a neutral impact, based on the latest non-farm payroll and related indicators compared to the previous value. The number of bearish indicators exceeds the number of bullish indicators, indicating an overall bearish trend. There are 25 bullish indicators for gold (bullish/bearish ratio 0.76).
Regarding crude oil, theoretically, US indicators that are bullish for gold are bearish for oil prices.
Analysts point out that when the market reacts to data such as the US non-farm payrolls report, oil prices usually move in the opposite direction to the US dollar briefly (the so-called market knee-jerk reaction), but crude oil quickly recovers and moves in the same direction as the US dollar index (which can be understood as a reaction to the strength or weakness of the fundamentals).
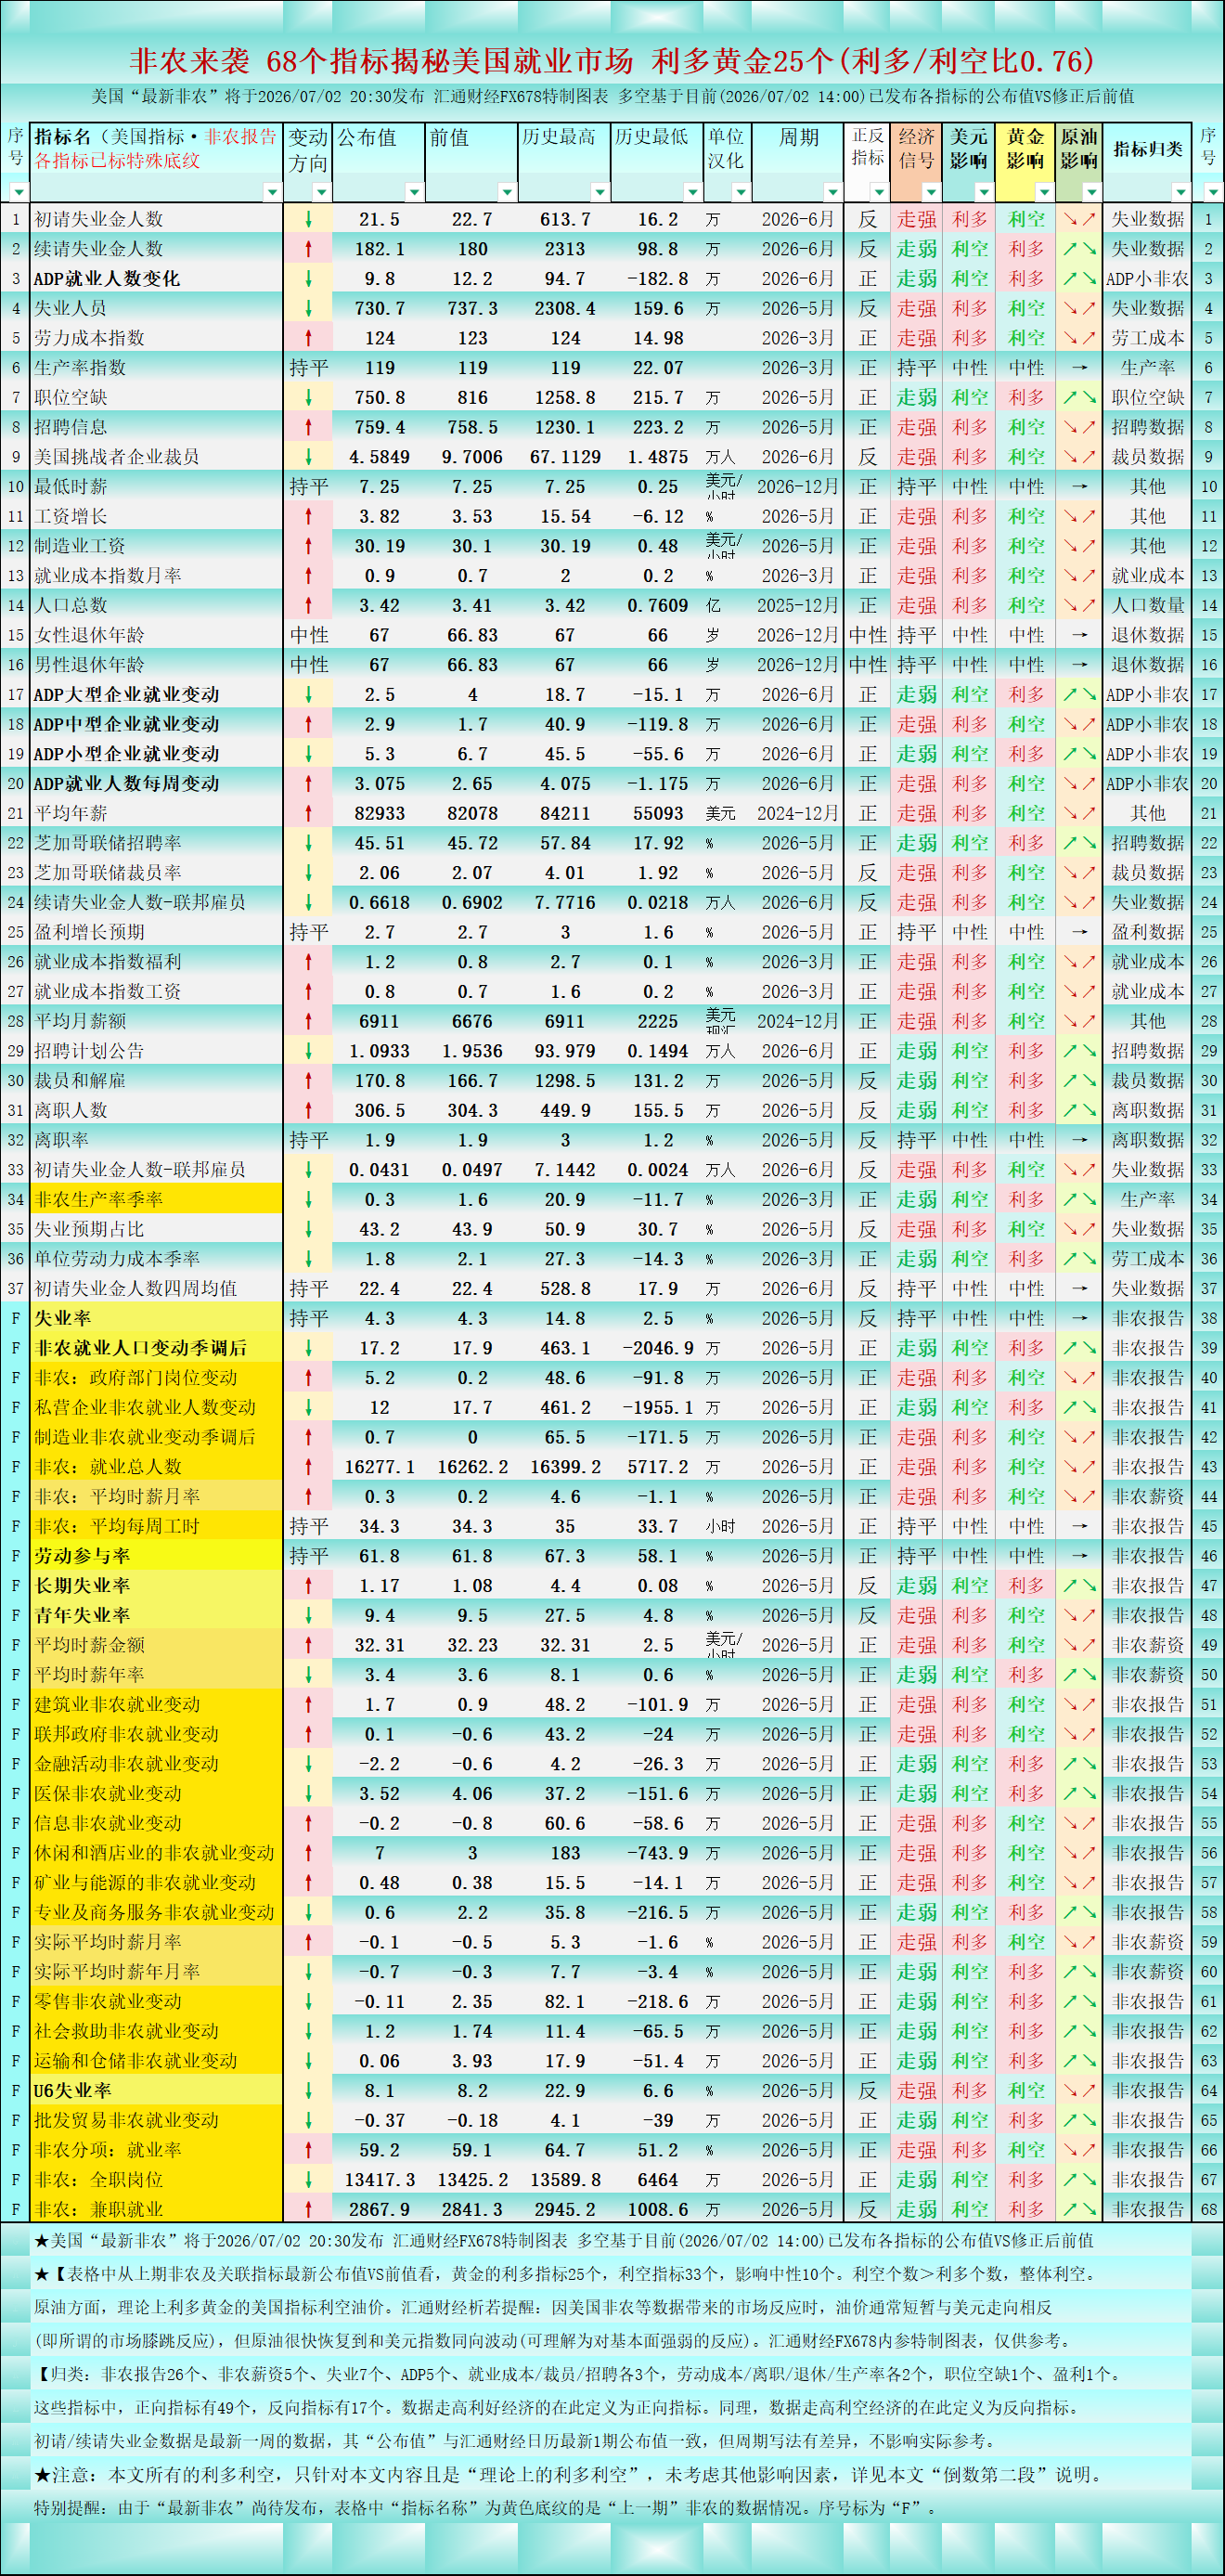
[Above chart: 68 indicators reveal the US job market, 25 of which are bullish for gold (bullish/bearish ratio 0.76). Source: FX678 special chart. This chart is based on the comparison between the previous US non-farm payrolls report and the previous value, which is currently only available (as of 14:00 on 2026/07/02).]
[Categorization: Non-farm payrolls (26), Non-farm wages (5), Unemployment (7), ADP (5), Employment costs/layoffs/hiring (3 each), Labor costs/turnovers/retirements/productivity (2 each), Job vacancies (1), Profits (1). ★Of these indicators, 49 are positive, 17 are negative, and 2 are neutral. Data that is positive for the economy is defined as a positive indicator. Similarly, data that is negative for the economy is defined as a negative indicator.]
★★ Special Note: The employment data above represents nominal improvements or deteriorations. For example, nominal wage growth may exist, but if inflation is high and exceeds wage growth, then real wages have actually decreased. Similarly, while real wages may appear high, a weak purchasing power of the country's currency (unrelated to foreign exchange conversion, as consumption occurs domestically, not abroad) could still only represent a nominal improvement for the general public. Please view this rationally.
Note: All bullish and bearish factors mentioned in this article refer only to the 68 US employment indicators shown in the chart, without considering other influencing factors. Furthermore, these are all "theoretical bullish and bearish factors," and actual market movements may contradict the theory. For example, a classic case of "bad news turning into good news" or "good news turning into bad news" can occur, resulting in a situation where a theoretically positive event actually leads to a price drop, and vice versa. Another example: if a commodity is technically in a downtrend, positive factors may cause the price to surge, but after the surge, concentrated selling pressure could lead to a deeper drop. However, studying "theoretical bullish and bearish factors" can be an important reference for advance planning and analyzing trading decisions. How to use this reference specifically will depend on the trading environment formed by other factors, the trader's own trading strategy, and mindset.
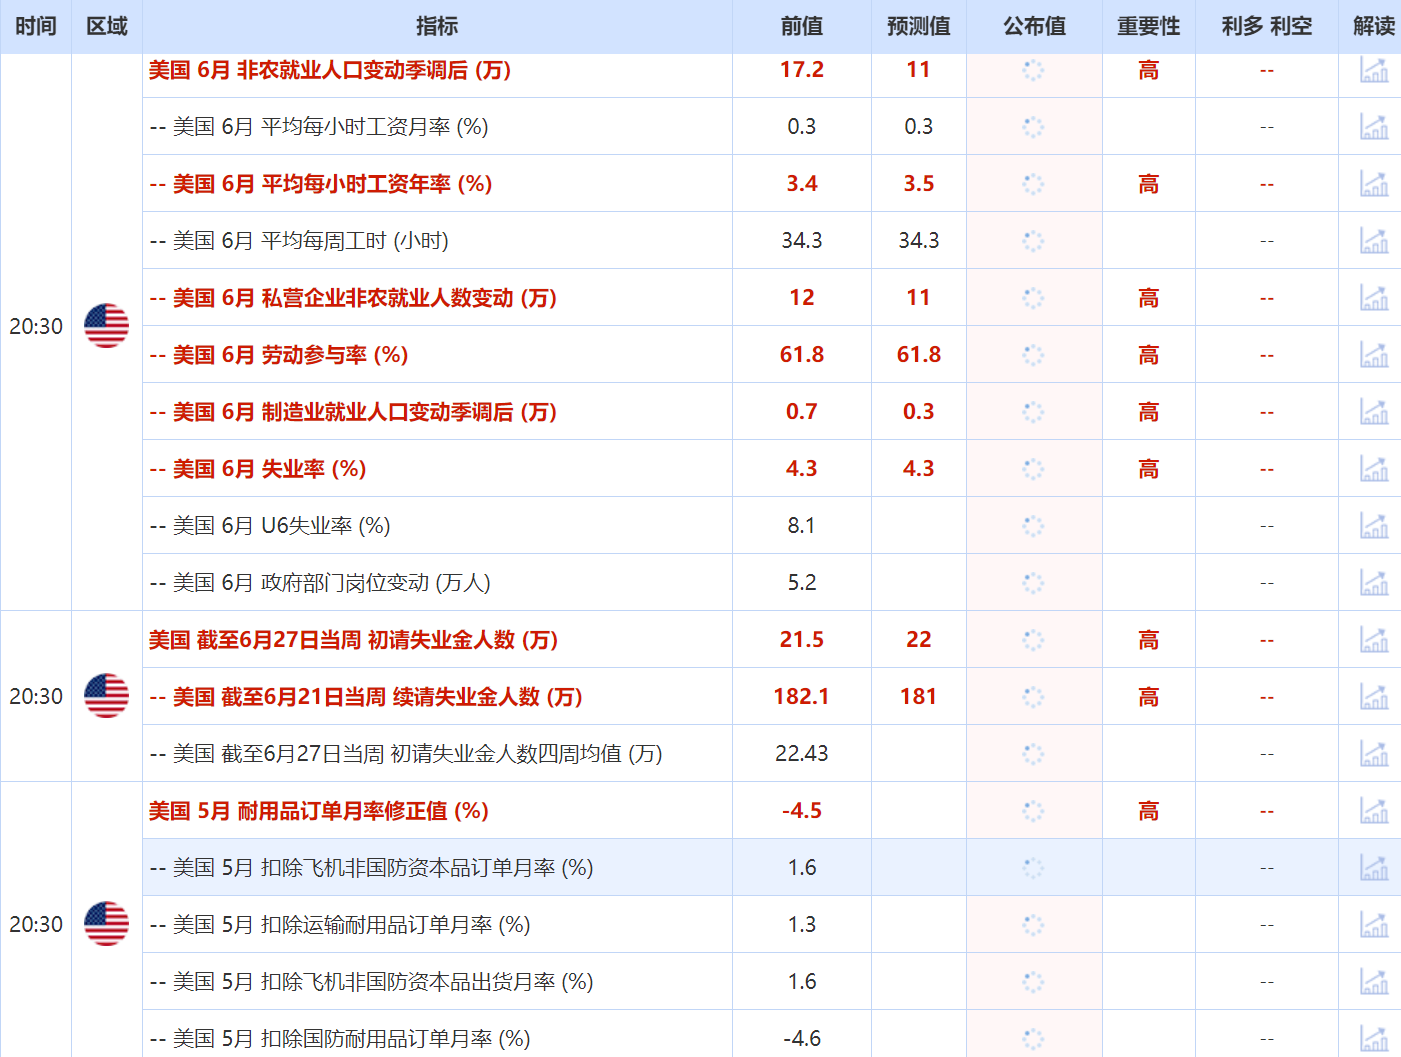
[Figure 2: The following is a summary of today's non-farm payroll indicators, previous values, and expected values]
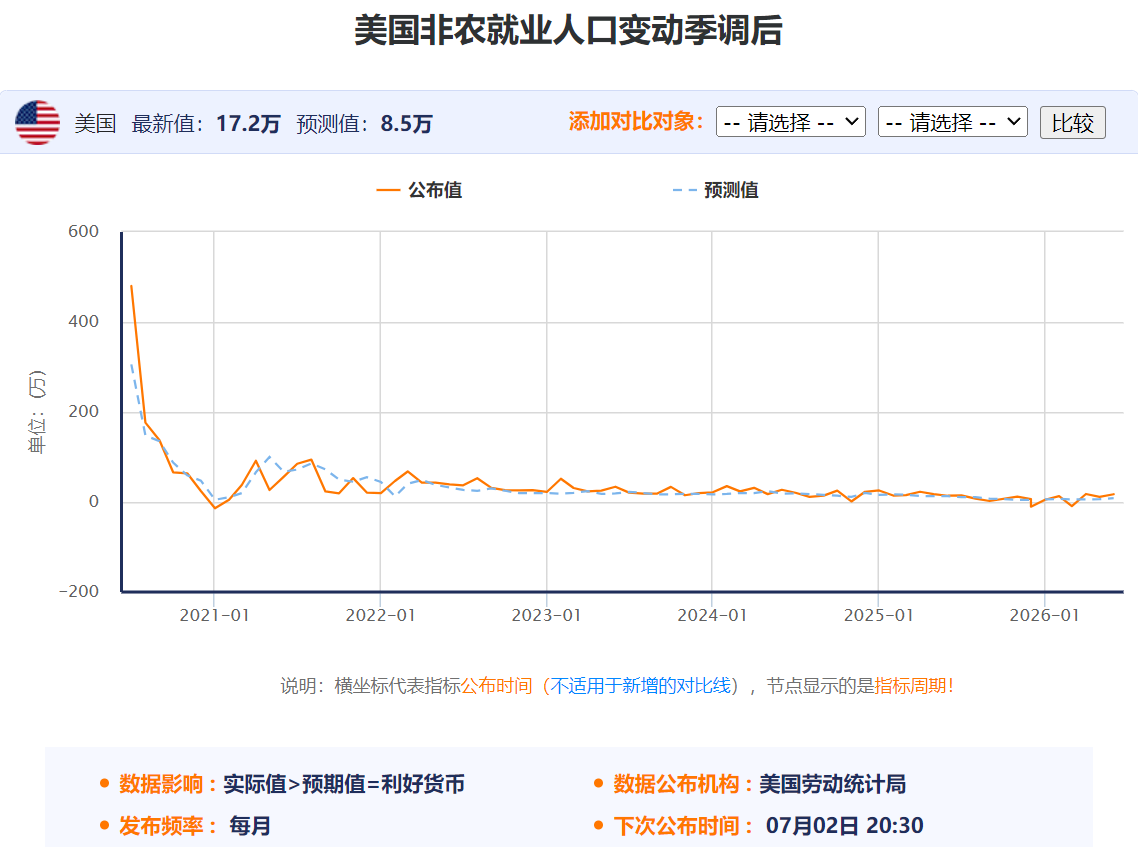
[Figure 3: Trend of "US Non-Farm Payrolls Change" over the past six years, including released and expected values. Source: FX678 Calendar Indicator Page.]
This article is an original production of FX678 and is copyrighted. It is for reference only and should not be used as a basis for trading.
The US non-farm payrolls report, considered a must-see in financial markets, will likely impact the market. The answer will be revealed tonight. This article features original charts that may offer a glimpse into the impact.
The table shows 25 bullish indicators and 33 bearish indicators for gold, with 10 having a neutral impact, based on the latest non-farm payroll and related indicators compared to the previous value. The number of bearish indicators exceeds the number of bullish indicators, indicating an overall bearish trend. There are 25 bullish indicators for gold (bullish/bearish ratio 0.76).
Regarding crude oil, theoretically, US indicators that are bullish for gold are bearish for oil prices.
Analysts point out that when the market reacts to data such as the US non-farm payrolls report, oil prices usually move in the opposite direction to the US dollar briefly (the so-called market knee-jerk reaction), but crude oil quickly recovers and moves in the same direction as the US dollar index (which can be understood as a reaction to the strength or weakness of the fundamentals).
[Above chart: 68 indicators reveal the US job market, 25 of which are bullish for gold (bullish/bearish ratio 0.76). Source: FX678 special chart. This chart is based on the comparison between the previous US non-farm payrolls report and the previous value, which is currently only available (as of 14:00 on 2026/07/02).]
[Categorization: Non-farm payrolls (26), Non-farm wages (5), Unemployment (7), ADP (5), Employment costs/layoffs/hiring (3 each), Labor costs/turnovers/retirements/productivity (2 each), Job vacancies (1), Profits (1). ★Of these indicators, 49 are positive, 17 are negative, and 2 are neutral. Data that is positive for the economy is defined as a positive indicator. Similarly, data that is negative for the economy is defined as a negative indicator.]
★★ Special Note: The employment data above represents nominal improvements or deteriorations. For example, nominal wage growth may exist, but if inflation is high and exceeds wage growth, then real wages have actually decreased. Similarly, while real wages may appear high, a weak purchasing power of the country's currency (unrelated to foreign exchange conversion, as consumption occurs domestically, not abroad) could still only represent a nominal improvement for the general public. Please view this rationally.
Note: All bullish and bearish factors mentioned in this article refer only to the 68 US employment indicators shown in the chart, without considering other influencing factors. Furthermore, these are all "theoretical bullish and bearish factors," and actual market movements may contradict the theory. For example, a classic case of "bad news turning into good news" or "good news turning into bad news" can occur, resulting in a situation where a theoretically positive event actually leads to a price drop, and vice versa. Another example: if a commodity is technically in a downtrend, positive factors may cause the price to surge, but after the surge, concentrated selling pressure could lead to a deeper drop. However, studying "theoretical bullish and bearish factors" can be an important reference for advance planning and analyzing trading decisions. How to use this reference specifically will depend on the trading environment formed by other factors, the trader's own trading strategy, and mindset.
[Figure 2: The following is a summary of today's non-farm payroll indicators, previous values, and expected values]
[Figure 3: Trend of "US Non-Farm Payrolls Change" over the past six years, including released and expected values. Source: FX678 Calendar Indicator Page.]
This article is an original production of FX678 and is copyrighted. It is for reference only and should not be used as a basis for trading.
- Risk Warning and Disclaimer
- The market involves risk, and trading may not be suitable for all investors. This article is for reference only and does not constitute personal investment advice, nor does it take into account certain users’ specific investment objectives, financial situation, or other needs. Any investment decisions made based on this information are at your own risk.