Gold prices approached $4,200, while weak non-farm payroll data weighed on the dollar.
2026-07-03 21:55:57
On Friday morning (July 3), spot gold and spot silver prices rose sharply. The US domestic market was closed due to the Independence Day holiday; the weaker-than-expected US non-farm payroll data released on Thursday continued to put pressure on the dollar and US Treasury yields, while also driving short covering in the precious metals market, which was beneficial to gold and silver prices.
Spot gold traded around $4,166.73 per ounce, up 1.05% on the day; spot silver was at $62.179 per ounce, up 2.03% on the day.

Gold traded between $4,120.50 and $4,196.10 in early trading, just a step away from the key technical resistance level of $4,200, which is a significant target for the bulls in the next phase of their upward attack.
Silver traded between $60.80 and $63.02 in early trading, outperforming gold, and has now reached the first major resistance level since the release of the non-farm payroll data.
After the release of the non-farm payroll data, the market was dominated by bullish funds, but it was not a one-sided bullish trend.
In June, the U.S. added 57,000 non-farm jobs, and the unemployment rate fell slightly to 4.2%; however, the leisure and hospitality industry lost 61,000 jobs, while the private sector added only 49,000 jobs.
Weak employment data significantly dampened market expectations for a near-term Federal Reserve rate hike, causing the dollar to weaken and the 10-year Treasury yield to fall to around 4.5%. However, the market has not completely ruled out the possibility of further monetary tightening this year, with interest rate traders still betting on a certain probability of a Fed rate hike in the second half of the year.
Gold is currently benefiting from expectations of monetary easing due to weakening employment, but gold prices remain highly sensitive to a rebound in inflation expectations.
The situation in the Strait of Hormuz has generally eased, but risks related to waterway management have not been completely eliminated. Shipping traffic in the strait has returned to normal, and international oil prices have fallen back to pre-conflict levels: Brent crude is at $71.91 per barrel, and West Texas Intermediate (WTI) crude is at $68.62 per barrel. However, the US-Iran negotiations remain fragile, and the two sides have not yet resolved their differences on issues such as jurisdiction over the Strait of Hormuz and navigation costs.
At present, this geopolitical event has a slight deflationary effect on the overall market: lower oil prices alleviate the pressure on energy prices to push up yields and force the Federal Reserve to tighten monetary policy. The core driver of the current rise in gold prices comes from the decline in the US dollar and US Treasury yields, rather than safe-haven buying spurred by the Straits crisis.
Traders are closely watching the North American market, which is closed for the holidays and has thin liquidity, while awaiting two key data and policy events: the Consumer Price Index (CPI) to be released at 8:30 a.m. Eastern Time on July 14, and the Federal Reserve FOMC meeting on July 29.
The key test for gold's future performance lies in whether the positive effects of a cooling job market can offset the negative pressure from the Federal Reserve's continued efforts to combat inflation and the transmission of inflationary pressures through oil price fluctuations.
Spot Gold Technical Analysis
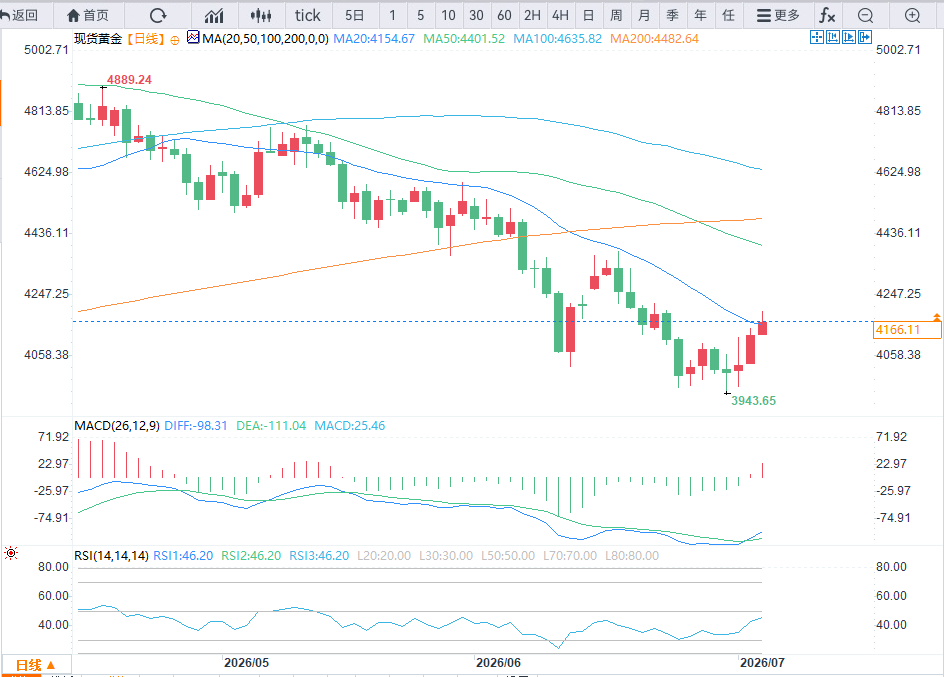
(Spot gold daily chart source: FX678)
The primary upside target for the bulls is to hold above the $4,200-$4,350 resistance zone. If this level is broken, the next target is $4,500, with the next long-term target at $5,000.
Short-term downside targets for the bears: a break below the key support level of $4,091, with further downside targets at $4,000 and $3,950.
First resistance level: $4,200; Second resistance level: $4,350.
First support level: $4091; Second support level: $4000.
Technical Analysis of Spot Silver

(Spot silver daily chart source: EasyTrade)
The primary upside target for the bulls is to break through the $64-$64.5 resistance zone. Once this level is established, the next target is $72, with a long-term high target of $89.
Downside targets for short sellers: a break below the $60.05 support level, with further downside targets at $58 and $55.
First resistance level: $64; Second resistance level: $64.5.
First support level: $60.05; Second support level: $58.
Spot gold traded around $4,166.73 per ounce, up 1.05% on the day; spot silver was at $62.179 per ounce, up 2.03% on the day.
Gold traded between $4,120.50 and $4,196.10 in early trading, just a step away from the key technical resistance level of $4,200, which is a significant target for the bulls in the next phase of their upward attack.
Silver traded between $60.80 and $63.02 in early trading, outperforming gold, and has now reached the first major resistance level since the release of the non-farm payroll data.
After the release of the non-farm payroll data, the market was dominated by bullish funds, but it was not a one-sided bullish trend.
In June, the U.S. added 57,000 non-farm jobs, and the unemployment rate fell slightly to 4.2%; however, the leisure and hospitality industry lost 61,000 jobs, while the private sector added only 49,000 jobs.
Weak employment data significantly dampened market expectations for a near-term Federal Reserve rate hike, causing the dollar to weaken and the 10-year Treasury yield to fall to around 4.5%. However, the market has not completely ruled out the possibility of further monetary tightening this year, with interest rate traders still betting on a certain probability of a Fed rate hike in the second half of the year.
Gold is currently benefiting from expectations of monetary easing due to weakening employment, but gold prices remain highly sensitive to a rebound in inflation expectations.
The situation in the Strait of Hormuz has generally eased, but risks related to waterway management have not been completely eliminated. Shipping traffic in the strait has returned to normal, and international oil prices have fallen back to pre-conflict levels: Brent crude is at $71.91 per barrel, and West Texas Intermediate (WTI) crude is at $68.62 per barrel. However, the US-Iran negotiations remain fragile, and the two sides have not yet resolved their differences on issues such as jurisdiction over the Strait of Hormuz and navigation costs.
At present, this geopolitical event has a slight deflationary effect on the overall market: lower oil prices alleviate the pressure on energy prices to push up yields and force the Federal Reserve to tighten monetary policy. The core driver of the current rise in gold prices comes from the decline in the US dollar and US Treasury yields, rather than safe-haven buying spurred by the Straits crisis.
Traders are closely watching the North American market, which is closed for the holidays and has thin liquidity, while awaiting two key data and policy events: the Consumer Price Index (CPI) to be released at 8:30 a.m. Eastern Time on July 14, and the Federal Reserve FOMC meeting on July 29.
The key test for gold's future performance lies in whether the positive effects of a cooling job market can offset the negative pressure from the Federal Reserve's continued efforts to combat inflation and the transmission of inflationary pressures through oil price fluctuations.
Spot Gold Technical Analysis
(Spot gold daily chart source: FX678)
The primary upside target for the bulls is to hold above the $4,200-$4,350 resistance zone. If this level is broken, the next target is $4,500, with the next long-term target at $5,000.
Short-term downside targets for the bears: a break below the key support level of $4,091, with further downside targets at $4,000 and $3,950.
First resistance level: $4,200; Second resistance level: $4,350.
First support level: $4091; Second support level: $4000.
Technical Analysis of Spot Silver
(Spot silver daily chart source: EasyTrade)
The primary upside target for the bulls is to break through the $64-$64.5 resistance zone. Once this level is established, the next target is $72, with a long-term high target of $89.
Downside targets for short sellers: a break below the $60.05 support level, with further downside targets at $58 and $55.
First resistance level: $64; Second resistance level: $64.5.
First support level: $60.05; Second support level: $58.
- Risk Warning and Disclaimer
- The market involves risk, and trading may not be suitable for all investors. This article is for reference only and does not constitute personal investment advice, nor does it take into account certain users’ specific investment objectives, financial situation, or other needs. Any investment decisions made based on this information are at your own risk.