Gold Market Outlook: Spot gold continues to rise after non-farm payroll data release.
2026-07-04 00:39:37
Gold prices rebounded sharply on Thursday after weak US non-farm payroll data was released, and the rebound has continued. Although gold has started the month and quarter with an upward trend, it's important to note that it has just experienced one of its most difficult quarters in recent years, falling nearly 30% from its January high. The consecutive months of declines in gold prices in the second quarter reflect a fundamental shift in market sentiment: investors are reassessing the Federal Reserve's interest rate path and the US economic outlook.

One of the biggest headwinds currently facing gold is the Federal Reserve's latest policy stance. Under Kevin Warsh's leadership, the Fed has decided to abandon forward guidance. Regardless of the recent weak jobs data, the market is increasingly convinced that the US will continue to raise interest rates, and that the high-interest-rate environment will persist for a long time. Gold is a non-interest-bearing asset, and persistently high interest rates will significantly reduce its attractiveness. If inflation stickiness far exceeds market expectations, forcing the Fed to raise rates again later this year, the downward pressure on gold prices may intensify further.
Meanwhile, a stronger dollar and rising US Treasury yields continued to hinder the recovery momentum of gold prices. Admittedly, the weaker dollar on Thursday briefly provided some breathing room for gold prices, but this rise is likely just a short-term rebound, not a trend reversal.
Central bank gold purchases remain a core support for the market, with many countries continuing to de-dollarize their foreign exchange reserves; however, the positive support for gold from geopolitical tensions is waning. Following the US-Iran agreement to reopen the Strait of Hormuz, market attention has shifted back to economic data and monetary policy, and traditional safe-haven demand for gold has cooled significantly.
Technical Analysis
Gold prices surged yesterday, boosted by a weaker dollar, and the rebound continued today. Gold has closed above $4,000 for several consecutive trading days, a bullish signal.
Even so, until we see a stronger bullish trend, our medium- to long-term bearish view on gold will not change, and we do not yet believe that gold prices have found a valid bottom. At this stage, we characterize this round of gains as a counter-trend rebound, and the overall downward trend in the long-term gold price cycle remains unchanged.
Gold Key Price Level Forecast
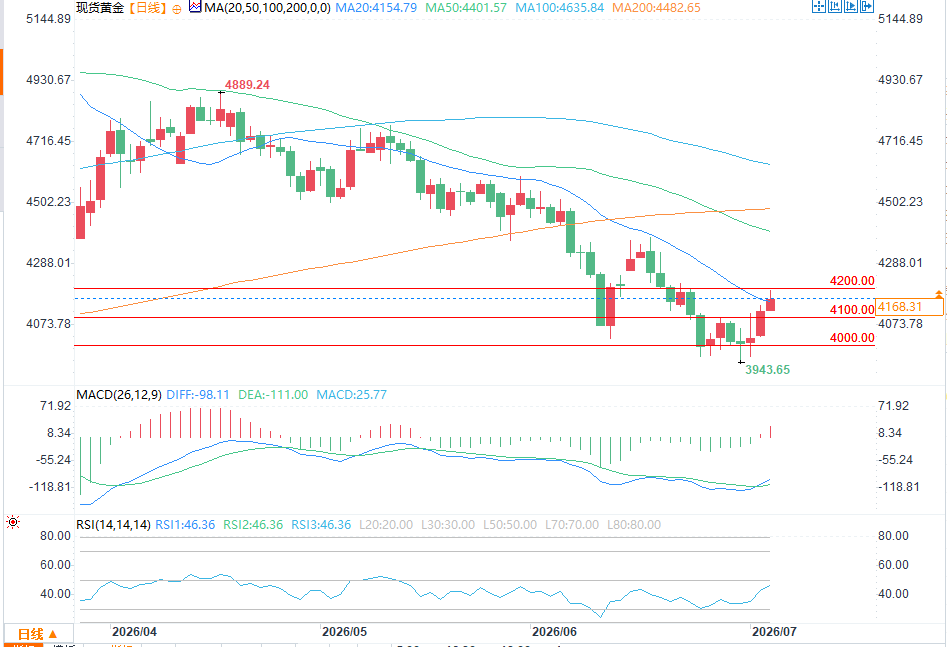
(Spot gold daily chart source: FX678)
The key resistance zone on the daily chart is between $4195 and $4200, which also coincides with the downtrend resistance line. A decisive break above this zone would significantly strengthen the bullish technical outlook.
Conversely, if gold prices reverse course from their current levels and fall below the $4,100 support zone (the shaded area on the chart, $4,098-$4,136), the short-term market will return to a bearish trend.
Analysts believe that only a daily close below $4,000 would trigger a new round of technical selling pressure in the coming days and weeks; if this occurs, the overall bearish outlook for gold will be restored. Based on the current technical pattern, a neutral to wait-and-see attitude is warranted for gold.
At 00:36 Beijing time, spot gold was trading at $4,169.29 per ounce, up 1.11%.
One of the biggest headwinds currently facing gold is the Federal Reserve's latest policy stance. Under Kevin Warsh's leadership, the Fed has decided to abandon forward guidance. Regardless of the recent weak jobs data, the market is increasingly convinced that the US will continue to raise interest rates, and that the high-interest-rate environment will persist for a long time. Gold is a non-interest-bearing asset, and persistently high interest rates will significantly reduce its attractiveness. If inflation stickiness far exceeds market expectations, forcing the Fed to raise rates again later this year, the downward pressure on gold prices may intensify further.
Meanwhile, a stronger dollar and rising US Treasury yields continued to hinder the recovery momentum of gold prices. Admittedly, the weaker dollar on Thursday briefly provided some breathing room for gold prices, but this rise is likely just a short-term rebound, not a trend reversal.
Central bank gold purchases remain a core support for the market, with many countries continuing to de-dollarize their foreign exchange reserves; however, the positive support for gold from geopolitical tensions is waning. Following the US-Iran agreement to reopen the Strait of Hormuz, market attention has shifted back to economic data and monetary policy, and traditional safe-haven demand for gold has cooled significantly.
Technical Analysis
Gold prices surged yesterday, boosted by a weaker dollar, and the rebound continued today. Gold has closed above $4,000 for several consecutive trading days, a bullish signal.
Even so, until we see a stronger bullish trend, our medium- to long-term bearish view on gold will not change, and we do not yet believe that gold prices have found a valid bottom. At this stage, we characterize this round of gains as a counter-trend rebound, and the overall downward trend in the long-term gold price cycle remains unchanged.
Gold Key Price Level Forecast
(Spot gold daily chart source: FX678)
The key resistance zone on the daily chart is between $4195 and $4200, which also coincides with the downtrend resistance line. A decisive break above this zone would significantly strengthen the bullish technical outlook.
Conversely, if gold prices reverse course from their current levels and fall below the $4,100 support zone (the shaded area on the chart, $4,098-$4,136), the short-term market will return to a bearish trend.
Analysts believe that only a daily close below $4,000 would trigger a new round of technical selling pressure in the coming days and weeks; if this occurs, the overall bearish outlook for gold will be restored. Based on the current technical pattern, a neutral to wait-and-see attitude is warranted for gold.
At 00:36 Beijing time, spot gold was trading at $4,169.29 per ounce, up 1.11%.
- Risk Warning and Disclaimer
- The market involves risk, and trading may not be suitable for all investors. This article is for reference only and does not constitute personal investment advice, nor does it take into account certain users’ specific investment objectives, financial situation, or other needs. Any investment decisions made based on this information are at your own risk.