With weather premiums squeezed out, the corn market is left with only one key figure.
2026-07-10 20:25:08
On Friday, July 10th, the focus of grain market trading shifted from simply betting on the risks of high temperatures to awaiting the USDA's monthly supply and demand report to recalibrate asset pricing. Corn futures have fallen for several consecutive days, with the most active contract dropping by about 3% over three days, returning to around $4.48 per bushel, but still up 3.03% for the month. Soybeans were at 1176.86 cents per bushel, and wheat at 606.17 cents per bushel, indicating that this was not an isolated decline, but rather a repricing of the grain sector following a temporary cooling of the weather premium.
The immediate trigger for this round of corn price declines is the easing of the short-term threat of extreme heat in the US Corn Belt. The market's previous rapid increase in weather premiums was logically simple: mid-to-late July is the corn pollination window, and high temperatures coupled with insufficient rainfall directly impact seed setting rate and yield realization. However, the latest forecasts have not completely eliminated the risks. A 6-10 day outlook released by a US climate forecasting agency on July 9th indicates that from July 15th to 19th, temperatures in most parts of the continental US will remain above average, with a high probability of high temperatures in parts of the northern high plains. Meanwhile, the probability of below-average rainfall is increasing in the northern Mississippi Valley, the northern and central Great Plains, and adjacent areas of the western Great Lakes region.
This means that a price drop does not equate to a bearish fundamental outlook, but rather a shift in market sentiment from "extreme heatwave trading" to "high temperatures persisting but with a slowing marginal deterioration." The key is not to look at a single day's temperature, but rather at the persistence of high temperatures within the pollination window, nighttime temperatures, soil moisture, and rainfall coverage. If the heatwave merely returns from extreme conditions to a more moderate level, the weather premium will be reversed; if the moderate heat and dryness persist into late July, prices will again demand risk compensation.
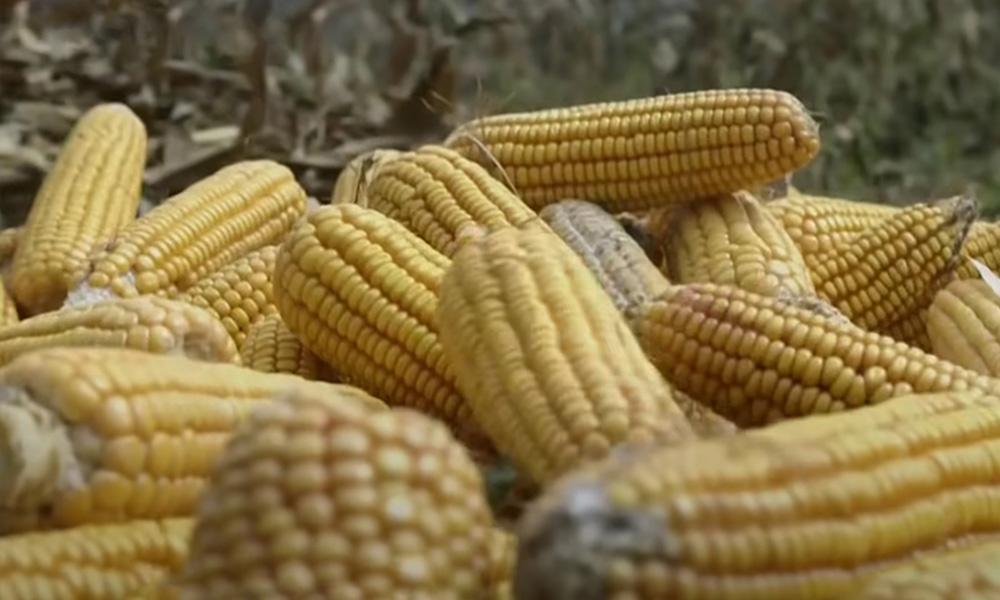
The USDA's July supply and demand report will be released early this morning. The June report clearly outlined the baseline: 2026/27 US corn planting area is 95.3 million acres, harvested area is 87.4 million acres, trend yield is 183 bushels per acre, production is 15.995 billion bushels, ending stocks are 1.96 billion bushels, and the average farm price is $4.40 per bushel.
Traders aren't really focused on the report title, but rather on the flexibility within the inventory table. Whether old-crop export demand will be revised upwards, whether new-crop yields will be revised ahead of schedule, and whether feed and ethanol demand will remain stable are the core variables determining the report's impact. Recent market expectations have been relatively restrained. Some institutions believe that old-crop corn exports may be revised upwards, ethanol demand is likely to remain unchanged, and new-crop corn demand and yields will not be adjusted for the time being. Export sales commitments have reached 101% of the USDA's current full-year forecast, higher than the five-year average of 95%, and export inspection progress is 82%, also slightly higher than the five-year average of 80%.
Soybeans present a different picture. May soybean crush volume was 213 million bushels, lower than April's 218 million bushels, but higher than the 204 million bushels projected for May 2025. The market expects new crop soybean ending stocks to increase by 30 million bushels to 340 million bushels due to an upward revision in planted area. This will suppress risk appetite in the oilseed sector, explaining why corn, soybeans, and wheat weakened simultaneously, rather than a single commodity adjusting independently.
A short-term cooling in the US Corn Belt caused corn prices to fall, but crop stress in Europe continues to increase uncertainty in global feed grains. In late June, temperatures in parts of France reached 40°C or higher. At that time, about 10% of corn in the southwestern Novo Aquitaine was in the flowering stage, and temperatures exceeding 35°C could lead to incomplete pollination, directly impacting yield. On June 22nd, the good-to-excellent rating for French corn was 76%, and the poor-to-excellent rating was 7%, but subsequent heat waves and drought made the market more cautious in pricing based on yield.
The importance of the European situation lies in the transmission of import demand. In June, the EU's 2026/27 corn production is projected at 57.5 million tons, lower than the 25-year average of 61.5 million tons; imports are projected at 19.5 million tons, higher than the previous year's 18.5 million tons. If drought losses continue to widen, import demand could approach the 2018 high of 23.6 million tons, at least 4 million tons higher than current estimates. This will change the relative value of corn, wheat, and barley in European feed formulations and also affect the grain price differential across the Atlantic. Satellite vegetation indicators also show that the late June heatwave in Europe, below-average rainfall, and declining vegetation indices are drawing market attention to the risk of French corn and sunflower seed yields.
The current structural characteristics of the grain market are that near-term prices are suppressed by risks reported in the US, while long-term expectations remain supported by weather and inventory levels. The decline in corn prices indicates crowded trading during the previous heat wave, especially before the report, as some funds reduced their one-way exposure. However, from a fundamental perspective, the ending stocks of 1.96 billion bushels of new-crop corn are not particularly tight, but neither are they loose enough to ignore pollination risks. Once the yield is revised downward from 183.0 bushels per acre, the balance sheet's elasticity to price will increase rapidly.
The correlation between wheat and soybeans also needs to be included in this framework. If reduced corn production in Europe increases local import demand, wheat and barley may be used as substitutes in the feed market, thus limiting the decline in wheat prices. If soybean inventories increase due to revised acreage, oilseed prices may weaken the overall risk premium for agricultural products. Three dimensions are truly worth tracking: first, whether yield and inventory levels changed in the July report; second, whether the distribution of high temperatures and rainfall in the US Corn Belt worsened from July 15th to 23rd; and third, whether the European corn quality rating and import expectations continue to revise towards a tighter balance. The short-term price decline has not ended the weather-driven market; it has merely pulled the market back from sentiment-based trading to data-driven trading.
The immediate trigger for this round of corn price declines is the easing of the short-term threat of extreme heat in the US Corn Belt. The market's previous rapid increase in weather premiums was logically simple: mid-to-late July is the corn pollination window, and high temperatures coupled with insufficient rainfall directly impact seed setting rate and yield realization. However, the latest forecasts have not completely eliminated the risks. A 6-10 day outlook released by a US climate forecasting agency on July 9th indicates that from July 15th to 19th, temperatures in most parts of the continental US will remain above average, with a high probability of high temperatures in parts of the northern high plains. Meanwhile, the probability of below-average rainfall is increasing in the northern Mississippi Valley, the northern and central Great Plains, and adjacent areas of the western Great Lakes region.
This means that a price drop does not equate to a bearish fundamental outlook, but rather a shift in market sentiment from "extreme heatwave trading" to "high temperatures persisting but with a slowing marginal deterioration." The key is not to look at a single day's temperature, but rather at the persistence of high temperatures within the pollination window, nighttime temperatures, soil moisture, and rainfall coverage. If the heatwave merely returns from extreme conditions to a more moderate level, the weather premium will be reversed; if the moderate heat and dryness persist into late July, prices will again demand risk compensation.
The USDA's July supply and demand report will be released early this morning. The June report clearly outlined the baseline: 2026/27 US corn planting area is 95.3 million acres, harvested area is 87.4 million acres, trend yield is 183 bushels per acre, production is 15.995 billion bushels, ending stocks are 1.96 billion bushels, and the average farm price is $4.40 per bushel.
Traders aren't really focused on the report title, but rather on the flexibility within the inventory table. Whether old-crop export demand will be revised upwards, whether new-crop yields will be revised ahead of schedule, and whether feed and ethanol demand will remain stable are the core variables determining the report's impact. Recent market expectations have been relatively restrained. Some institutions believe that old-crop corn exports may be revised upwards, ethanol demand is likely to remain unchanged, and new-crop corn demand and yields will not be adjusted for the time being. Export sales commitments have reached 101% of the USDA's current full-year forecast, higher than the five-year average of 95%, and export inspection progress is 82%, also slightly higher than the five-year average of 80%.
Soybeans present a different picture. May soybean crush volume was 213 million bushels, lower than April's 218 million bushels, but higher than the 204 million bushels projected for May 2025. The market expects new crop soybean ending stocks to increase by 30 million bushels to 340 million bushels due to an upward revision in planted area. This will suppress risk appetite in the oilseed sector, explaining why corn, soybeans, and wheat weakened simultaneously, rather than a single commodity adjusting independently.
A short-term cooling in the US Corn Belt caused corn prices to fall, but crop stress in Europe continues to increase uncertainty in global feed grains. In late June, temperatures in parts of France reached 40°C or higher. At that time, about 10% of corn in the southwestern Novo Aquitaine was in the flowering stage, and temperatures exceeding 35°C could lead to incomplete pollination, directly impacting yield. On June 22nd, the good-to-excellent rating for French corn was 76%, and the poor-to-excellent rating was 7%, but subsequent heat waves and drought made the market more cautious in pricing based on yield.
The importance of the European situation lies in the transmission of import demand. In June, the EU's 2026/27 corn production is projected at 57.5 million tons, lower than the 25-year average of 61.5 million tons; imports are projected at 19.5 million tons, higher than the previous year's 18.5 million tons. If drought losses continue to widen, import demand could approach the 2018 high of 23.6 million tons, at least 4 million tons higher than current estimates. This will change the relative value of corn, wheat, and barley in European feed formulations and also affect the grain price differential across the Atlantic. Satellite vegetation indicators also show that the late June heatwave in Europe, below-average rainfall, and declining vegetation indices are drawing market attention to the risk of French corn and sunflower seed yields.
The current structural characteristics of the grain market are that near-term prices are suppressed by risks reported in the US, while long-term expectations remain supported by weather and inventory levels. The decline in corn prices indicates crowded trading during the previous heat wave, especially before the report, as some funds reduced their one-way exposure. However, from a fundamental perspective, the ending stocks of 1.96 billion bushels of new-crop corn are not particularly tight, but neither are they loose enough to ignore pollination risks. Once the yield is revised downward from 183.0 bushels per acre, the balance sheet's elasticity to price will increase rapidly.
The correlation between wheat and soybeans also needs to be included in this framework. If reduced corn production in Europe increases local import demand, wheat and barley may be used as substitutes in the feed market, thus limiting the decline in wheat prices. If soybean inventories increase due to revised acreage, oilseed prices may weaken the overall risk premium for agricultural products. Three dimensions are truly worth tracking: first, whether yield and inventory levels changed in the July report; second, whether the distribution of high temperatures and rainfall in the US Corn Belt worsened from July 15th to 23rd; and third, whether the European corn quality rating and import expectations continue to revise towards a tighter balance. The short-term price decline has not ended the weather-driven market; it has merely pulled the market back from sentiment-based trading to data-driven trading.
- Risk Warning and Disclaimer
- The market involves risk, and trading may not be suitable for all investors. This article is for reference only and does not constitute personal investment advice, nor does it take into account certain users’ specific investment objectives, financial situation, or other needs. Any investment decisions made based on this information are at your own risk.