With both CPI and PPI cooling down, what signal does the pullback in gold prices send?
2026-07-16 16:54:12
On Thursday, July 16, spot gold prices fell back after a brief surge driven by US inflation data, currently hovering around $4,030 per ounce. Over the past month, gold prices have retreated by about 7%, but are still about 20% higher than the same period last year. The core issue in the current market is not simply the strength of safe-haven demand, but rather the secondary impact on inflation, interest rates, and liquidity expectations following regional conflicts that have driven up energy prices. 
 In the MACD indicator, the fast line is around -67 and the slow line is around -76, with the histogram values rebounding into positive territory, indicating that the downward momentum has weakened compared to the previous period. However, both indicator lines are still below the zero axis. This combination is closer to a momentum recovery in a weak market than a confirmed trend reversal. The $4100 to $4125 area has stronger structural significance. This range is close to the Bollinger Band middle line and is also where multiple daily candlestick bodies and rebound highs have converged. Only when prices return above this equilibrium area can the market structure shift from a one-sided downward trend to a more stable range consolidation. Conversely, if the $4000 level continues to lose support, the $3930 to $3950 area will again become a window for observing volatility expansion. Future pricing needs to simultaneously track three variables: the actual passage through the Strait of Hormuz, whether energy prices can remain high, and whether the interest rate market continues to reduce the probability of a Fed rate hike in July. At present, macroeconomic data supports gold, but the energy shock and technical weakness have not disappeared, and the market is still in a phase where interest rate gains and inflation risks offset each other.
Why has cooling inflation failed to drive a sustained rise in gold prices?
The U.S. Consumer Price Index (CPI) fell 0.4% month-over-month in June, with the year-over-year increase slowing to 3.5% from 4.2% in May. The core CPI, excluding food and energy, remained flat month-over-month, with the year-over-year increase decreasing to 2.6% from 2.9%. Housing costs rose only 0.1% month-over-month, the smallest increase since January 2021, indicating a substantial easing of service inflation stickiness. Production-side data was also weak. The final demand producer price index (PPI) fell 0.3% month-over-month in June, but rose 5.5% year-over-year; goods prices fell 1.4%, energy prices fell 6.4%, gasoline prices fell 12%, while service prices still rose 0.2%. Considering the composition of consumer and producer prices, the market expects the core personal consumption expenditure price index to rise by approximately 0.2% month-over-month. Following the data release, the probability of a Fed rate hike in July dropped rapidly from around 45% to around 10%. According to traditional pricing logic, a decline in expected real interest rates, a weaker dollar, and easing policy tightening risks should have been simultaneously bullish for gold. However, gold prices only briefly surged after the release of consumer price data before giving back their gains, and the producer price data also failed to trigger a second wave of upward movement. This indicates that the market has already partially priced in the cooling of inflation. More importantly, investors have not formed expectations of continued easing based on this. The rebound in energy prices is altering the inflation path in the coming months, and the market is even pricing in a higher rate hike at the end of the year. Gold is not facing a decline in current inflation, but rather a maturity mismatch between current data improvement and a renewed rise in long-term inflation risks.Why are regional conflicts becoming a source of pressure for gold?
Regional conflicts are often seen as bullish for gold, but this relationship is not linear. Currently, traffic in the Strait of Hormuz has decreased significantly, with the latest statistics showing only about seven ships passing through daily, down from 13 the previous day, and no large crude oil or LNG carriers are passing normally. This waterway typically handles about 20% of global energy transport; continued obstruction means the risk will first be reflected in crude oil, shipping, insurance, and long-term inflation expectations. When conflict creates short-term risk aversion, funds often flow into gold; when the conflict further evolves into an energy supply shock, the pricing chain becomes rising oil prices, increased inflation expectations, high policy interest rates, and a renewed strengthening of real yields, ultimately suppressing the valuation of non-interest-bearing assets. This week, crude oil prices have risen by about 11%, which is one of the key reasons why gold prices have failed to respond to inflation data. Furthermore, escalating conflicts may also lead to increased cash demand, increased margin pressure, and a reduction in multi-asset positions. While gold possesses safe-haven attributes, it is also a highly liquid asset with a large holding size; institutions may reduce their gold holdings simultaneously as they reduce their overall risk exposure. Therefore, the current market presents a seemingly abnormal but consistent structure across asset classes: escalating conflicts do not necessarily lead to higher gold prices, while de-escalating news may improve gold valuations by lowering oil prices and interest rate expectations.The daily chart structure indicates that gold is still in a weak rebalancing phase.
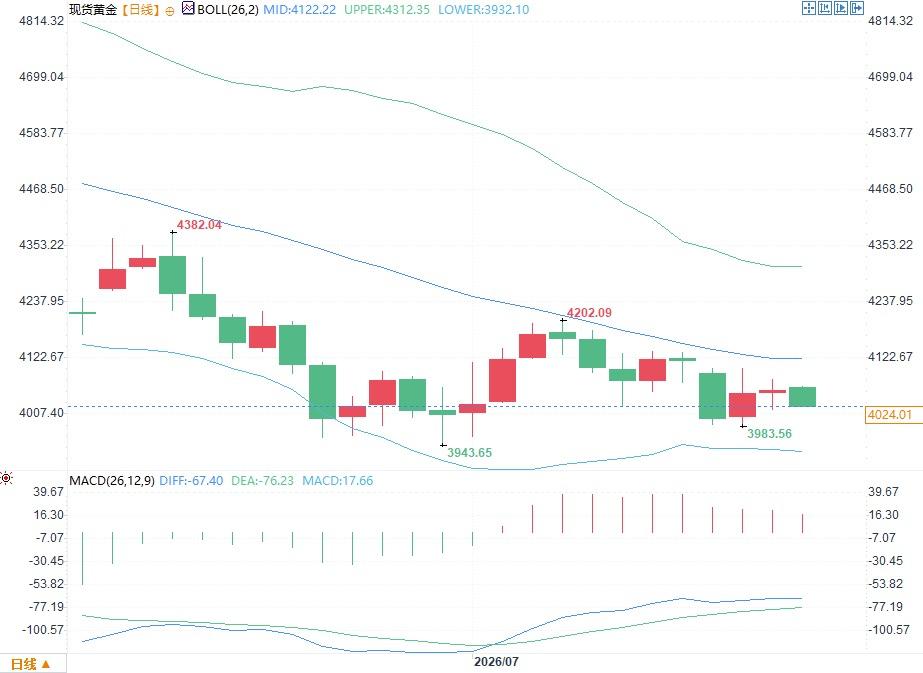
From a technical perspective, after falling from its high of $4382, gold prices rebounded to a high of $4202, forming a clear pattern of lower highs. The current price is below the Bollinger Band middle line at $4122, and the middle line itself continues to decline, indicating that the medium-term equilibrium price is still falling. The lower Bollinger Band is located at $3932, with recent lows appearing around $3944 and $3984. The $3950 to $4000 range has become a volatile area that the market has repeatedly tested. In the MACD indicator, the fast line is around -67 and the slow line is around -76, with the histogram values rebounding into positive territory, indicating that the downward momentum has weakened compared to the previous period. However, both indicator lines are still below the zero axis. This combination is closer to a momentum recovery in a weak market than a confirmed trend reversal. The $4100 to $4125 area has stronger structural significance. This range is close to the Bollinger Band middle line and is also where multiple daily candlestick bodies and rebound highs have converged. Only when prices return above this equilibrium area can the market structure shift from a one-sided downward trend to a more stable range consolidation. Conversely, if the $4000 level continues to lose support, the $3930 to $3950 area will again become a window for observing volatility expansion. Future pricing needs to simultaneously track three variables: the actual passage through the Strait of Hormuz, whether energy prices can remain high, and whether the interest rate market continues to reduce the probability of a Fed rate hike in July. At present, macroeconomic data supports gold, but the energy shock and technical weakness have not disappeared, and the market is still in a phase where interest rate gains and inflation risks offset each other.
- Risk Warning and Disclaimer
- The market involves risk, and trading may not be suitable for all investors. This article is for reference only and does not constitute personal investment advice, nor does it take into account certain users’ specific investment objectives, financial situation, or other needs. Any investment decisions made based on this information are at your own risk.