The ceasefire agreement has become worthless, and oil prices have surged 16% in a single week! History is repeating itself in the Strait of Hormuz, but this time Saudi Arabia has a backup plan.
2026-07-18 13:02:12
This week, the crude oil market experienced a dramatic repricing triggered by geopolitical tinderboxes. Brent crude surged approximately 16% for the week, closing at $88.08, a more than one-month high and marking its third consecutive week of gains; WTI crude also soared, closing at $81.77, a significant weekly increase. This trend was not driven by a slow evolution in supply and demand fundamentals, but rather by the escalation of military strikes between the US and Iran following the complete collapse of the US-Iran ceasefire agreement, with the intensity and frequency of these strikes exceeding market expectations. As airstrikes extended from night to day, and as the targets of retaliation expanded from military facilities to power plants and desalination plants, the pricing logic for crude oil abruptly shifted from inventory and demand expectations to a risk premium model based on supply disruptions. Adding to market unease, tanker traffic in the Strait of Hormuz has plummeted, and Iran's urging of the Houthis to "block the Red Sea if power facilities are attacked" has pushed this alternative shipping route into the spotlight. 
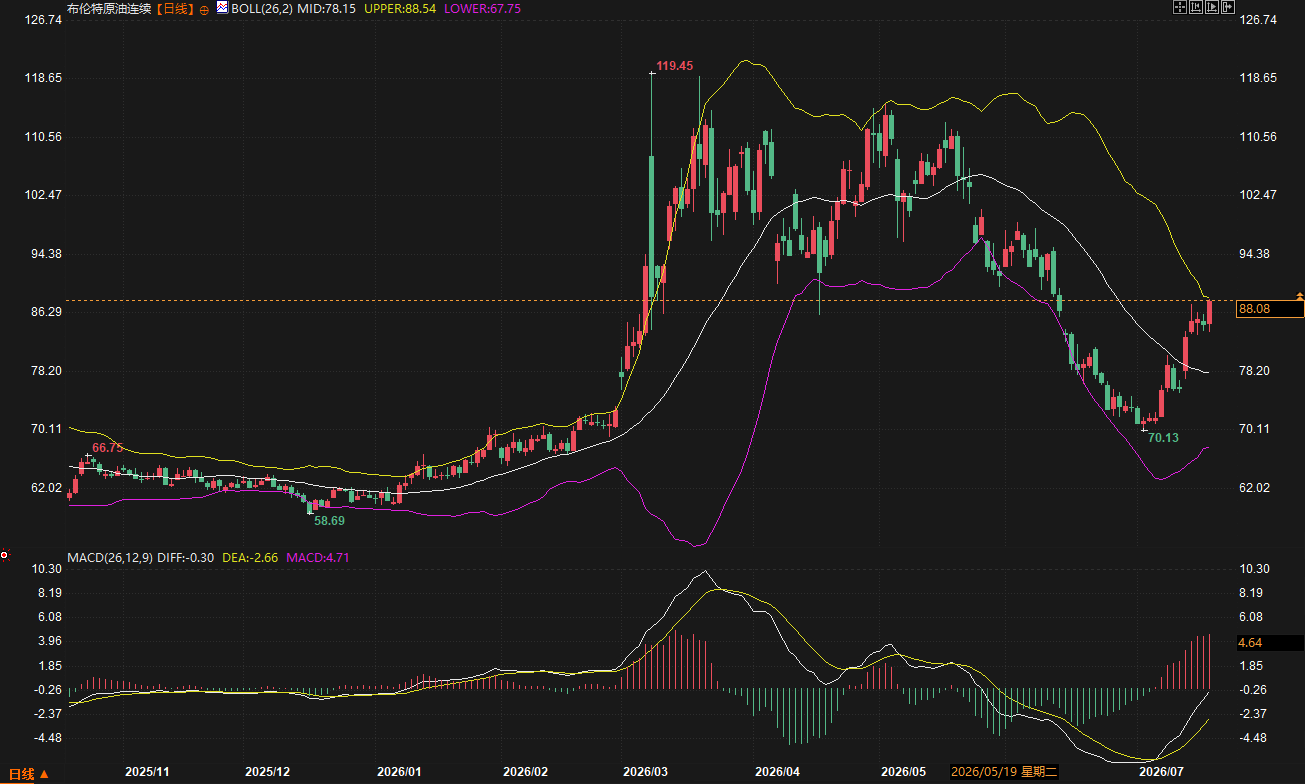
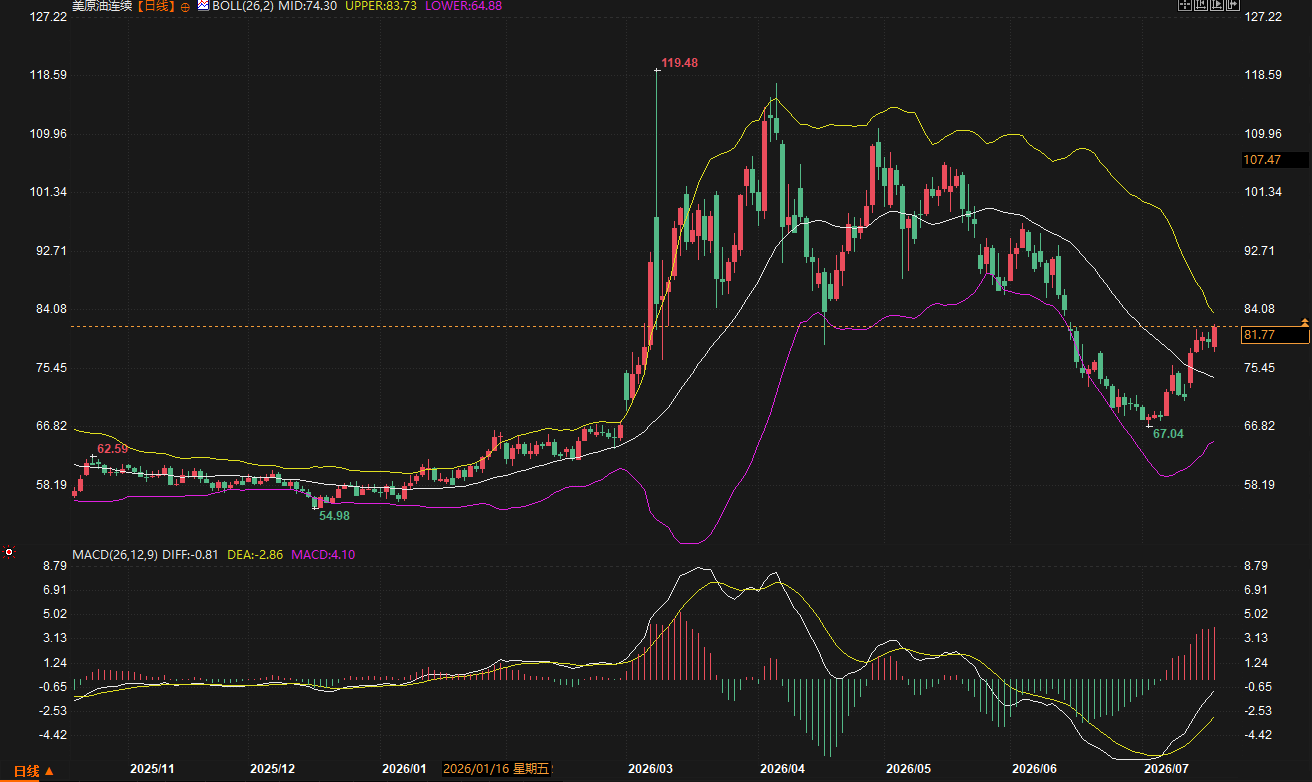
Brent crude oil: Approaching the upper Bollinger Band, technical indicators confirm a strong rebound.
This week, Brent crude oil prices exhibited a typical V-shaped reversal. After surging to a historic high of $119.45 in March 2026, oil prices experienced a deep correction lasting several months, hitting a low of $70.13. Recently, after confirming support near the $70 mark, rebound momentum rapidly accumulated, accelerating upwards this week, with the current price of $88.08 approaching the upper Bollinger Band at $88.54. Technically, the middle Bollinger Band is at 78.15, and the current price is well above it, indicating a strong uptrend. The MACD histogram is positive at 4.71, and the DIFF line has crossed above the DEA line, forming a clear golden cross signal, further strengthening bullish momentum. The price action suggests that this rebound is supported by both technical and fundamental factors, but it will also face direct resistance at the upper Bollinger Band at $88.54. Given the significant drop from 119.45 to 70.13 in the previous period, the current price is in the key Fibonacci retracement zone of this downward wave. The battle between bulls and bears here will determine whether the rebound can be upgraded into a trend reversal.US crude oil: Simultaneous breakout, speculative funds accelerate entry.
WTI crude oil prices moved in close tandem with Brent crude, previously surging to $119.48 before falling back to $67.04, before rebounding strongly this week to $81.77. Technically, the current price is between the Bollinger Band middle line at $74.30 and the upper band at $83.73, with about $2 of room remaining before the upper band, indicating slightly less technical pressure compared to Brent. The MACD histogram continues to expand, and the DIFF line has crossed above the DEA, a clear golden cross signal, suggesting a strong continuation of the rebound trend. Funding data provides crucial evidence. According to data released by the U.S. Commodity Futures Trading Commission on Friday, as of the week ending July 14, speculators increased their net long positions in WTI crude oil futures and options by 4,379 contracts to 70,059 contracts. A well-known foreign media report states that this data does not include the NYMEX financial crude oil futures contracts, which are usually included in the statistics, as this data was not provided this week; the actual increase in net speculative long positions may be more substantial than the reported figures. Marginal changes in position structure send a signal: against the backdrop of a continued expansion of geopolitical risk premiums, funds are shifting from a wait-and-see approach to betting, even though the overall net long position size is still at a historically neutral to low level.Geopolitical drivers: The Hormuz siege is blocked, and the threat from the Red Sea looms overhead.
This week's core driver for oil prices was the full escalation of the US-Iran conflict. Detailed reports from prominent foreign media outlets outlined a clear chain of escalation: after the ceasefire agreement broke down, the US attacked bridges and airports in Iran, while Tehran retaliated with attacks on Kuwaiti power plants and desalination plants, and announced its first direct strikes against US facilities in Syria. Andrew Lipow, president of Lipow Oil Associates, commented that the market is reacting to the escalating hostilities, and if more tankers are attacked or damaged, oil prices will continue to rise because shipowners are unwilling to sail into the Persian Gulf. Changes in shipping traffic provide a concrete illustration of this assessment. Before the conflict, approximately 20% of global oil supply passed through the Strait of Hormuz; this figure has now shrunk significantly. Meanwhile, Iran has urged the Houthis to block Red Sea shipping lanes if the US attacks its power infrastructure. Tamas Varga, an analyst at PVM Oil Associates, pointed out in a report that this threat hits the nail on the head—Saudi Arabia has already diverted most of its exports via the East-West Pipeline to the port of Yanbu on the Red Sea coast to bypass the Strait of Hormuz. Data shows that crude oil shipments from Yanbu Port have surged from approximately 973,000 barrels per day in the same period last year to approximately 4 million barrels per day recently, accounting for more than 70% of Saudi Arabia's normal exports. This means that if the Red Sea shipping route is indeed blocked, Saudi Arabia's alternative export routes will also be threatened, and the buffer space for global crude oil supply will be severely compressed. It is worth noting that in another conflict zone, the Ukrainian military claimed to have attacked Russian oil refineries in the Yaroslavl region on Thursday. Although the marginal impact of this event on oil prices has not yet materialized, the parallel development of multiple geopolitical events is creating a highly fragile supply environment. This week's surge in oil prices is essentially a concentrated release of geopolitical risk premiums. In the oversold area near $70, short covering and speculative long positions combined to push prices up to near the upper Bollinger Band technical resistance level. In the short term, the intensity of the US-Iran conflict remains the only core variable influencing oil prices. If the threat of disrupted Red Sea shipping evolves from verbal warnings into concrete action, it's not inconceivable that Brent crude could challenge or even break through its upper limit. Conversely, if both sides signal restraint at some point, the current premium built up due to panic will face rapid squeeze. The net increase in long positions revealed by CFTC positioning data is still moderate, perhaps indicating that some funds are still waiting for a clearer entry signal—either the Strait of Hormuz is truly paralyzed, or Yanbu Port is dragged into the risk zone. Until the supply path is completely blocked, every surge in oil prices carries the potential for a pullback.QA module
Oil prices surged 16% in a week. What are the fundamental differences between this rebound and previous geopolitical impulses? The difference lies in the fact that this rebound is not a short-lived impulse driven by a single event, but rather a complex supply crisis comprised of the complete collapse of the ceasefire agreement, the continuous expansion of targets by both sides, and the dual threats to shipping routes. Traffic in the Strait of Hormuz has been steadily declining, and the potential blockade of the Red Sea has brought alternative routes into the risk sphere. This situation of "main channels blocked, and alternative channels also unstable" has shifted market pricing of supply disruptions from short-term panic to medium-term concern. Meanwhile, after falling from $119 to $70, oil prices are technically in oversold territory, and the momentum of short covering has provided additional impetus for the rebound. Speculators' net long positions increased by only 4,379 contracts. Why can such a seemingly modest increase in positions support such a dramatic rise? The change in net long positions is based on data up to July 14th, and Friday's surge may not have been fully reflected. More importantly, this data omits the NYMEX financial crude oil futures contract portion, meaning the actual net long position may be larger than its book value. Furthermore, during periods of low prices, overall speculative long positions are already low, and sharp price increases are often driven more by short covering than by a large influx of new long positions. The moderate changes in open interest data may actually indicate that the market is not yet overcrowded, and if the geopolitical situation continues to deteriorate, there is still potential for further long position increases. Has Saudi Arabia's shift of exports to Yanbu Port to 4 million barrels per day fully hedged against the risks of the Hormuz crisis? While the expansion and rerouting of Yanbu Port has significantly improved the resilience of Saudi exports, it does not mean that the risks have been completely hedged. 4 million barrels per day is close to over 70% of Saudi Arabia's normal export volume, meaning that the strategic importance of Yanbu Port itself has risen to an unprecedented level. If the Red Sea route faces a real threat due to Houthi actions, the vulnerability of this alternative route will be instantly exposed. The capacity of the East-West oil pipeline is also not unlimited; if both channels are simultaneously restricted, Saudi exports will face severe challenges. The current situation is that the risk of one strait has been exchanged for dependence on another. Brent crude is approaching the upper Bollinger Band at 88.54; how much upside potential is there? The upper Bollinger Band is a dynamic technical resistance level, not an absolute barrier. Driven by news, prices may briefly pierce the upper band. However, it's important to note that the current price is near the 38.2% and 50% retracement levels of the previous high of 119.45 and low of 70.13, respectively, indicating increasing technical resistance. Whether Brent can effectively break through and hold the upper band depends on whether there is a substantial supply disruption, rather than just verbal threats. Why has the market reacted so calmly to Ukraine's attack on a Russian refinery? This is not the first time such an event has occurred, and the market has become somewhat "fatigued" by skirmishes involving energy facilities related to the Russia-Ukraine conflict. Compared to the threats in the Hormuz and Red Sea in the Middle East, this attack targeted refineries rather than crude oil export facilities, limiting its direct impact on global crude oil supply. However, if the frequency and intensity of such attacks continue to rise and begin to affect other export-related infrastructure, their marginal impact will be significant. Currently, market attention is highly focused on the evolution of the US-Iran conflict, with other geopolitical variables taking a secondary role.- Risk Warning and Disclaimer
- The market involves risk, and trading may not be suitable for all investors. This article is for reference only and does not constitute personal investment advice, nor does it take into account certain users’ specific investment objectives, financial situation, or other needs. Any investment decisions made based on this information are at your own risk.