Canadian inflation suddenly cooled; what signals are hidden around USD/CAD 1.4050?
2026-07-20 21:46:15
On Monday, July 20th, the USD/CAD pair rose sharply after the release of Canada's June inflation data, reaching a high of 1.4051, and was last quoted around 1.4045. Canada's June Consumer Price Index (CPI) rose 2.8% year-on-year, lower than the market expectation of 2.9% and significantly lower than May's 3.2%; month-on-month, it fell 0.4%, a larger drop than the expected 0.2%, and the largest monthly decline since December 2024. The cooling inflation reinforced market expectations of increased policy space for the Bank of Canada, weakening support for the Canadian dollar's interest rate and directly driving the USD/CAD pair to break through the 1.4040 area. 
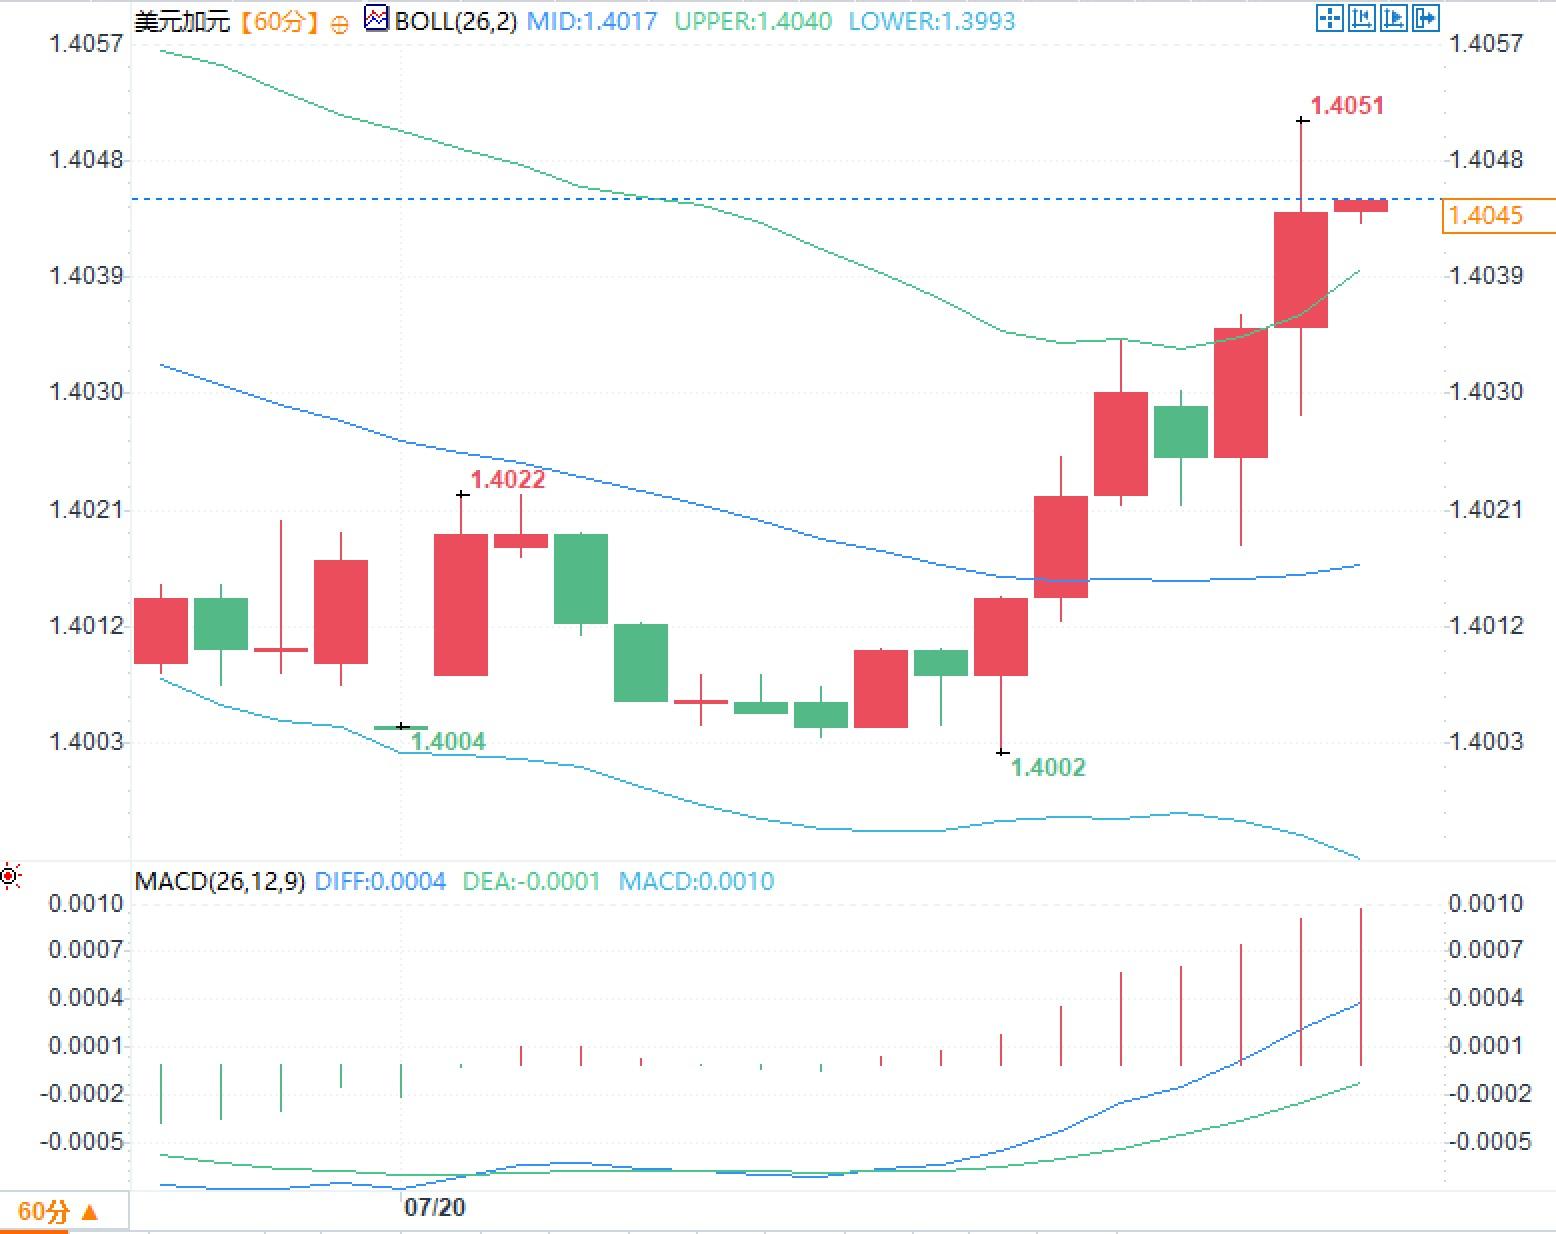 The MACD indicator's fast line rose to 0.0004, while the slow line remained around -0.0001, and the histogram expanded to 0.0010, reflecting strengthening upward momentum. However, a long upper shadow appeared near 1.4051, followed by a significant reduction in the candlestick body, indicating that the price encountered some selling pressure after breaking through the upper Bollinger Band. Therefore, the 1.4040 to 1.4051 range has become a key area for the market to test the sustainability of the data's impact.
Inflation is lower than expected, and the exchange rate is being re-included in policy easing space.
The key takeaway from this data isn't just the overall inflation rate falling from 3.2% to 2.8%, but rather the simultaneous slowdown in multiple fundamental inflation indicators. The core consumer price index (CPI) fell year-on-year to 2.1%, and month-on-month growth slowed to 0.1%, down from 0.6%. The weighted median inflation was 1.9%, lower than the expected and previous reading of 2.1%. The cut-off mean inflation fell from 2.0% to 1.8%, while general inflation declined from 2.7% to 2.6%. These indicators, each filtering out extreme price fluctuations from different perspectives, suggest that the simultaneous weakening of inflation is not solely due to a single commodity. In particular, the median and cut-off mean indicators have fallen back to around 2%, indicating that broad-based price pressures are easing. For the foreign exchange market, this reduces the need for the Bank of Canada to maintain a tight policy stance and lowers the short-term Canadian dollar interest rate premium. However, policy decisions should not be based solely on single-month overall data. Excluding gasoline, the CPI remained at 2.2% year-on-year, unchanged from the previous month, indicating that the underlying price level has not experienced a sharp decline. Seasonally adjusted overall prices fell 0.1% month-over-month, marking the first negative growth since April 2025, but core prices still rose 0.2% seasonally adjusted. Therefore, this report is closer to a mild cooling rather than a sudden contraction in demand.Gasoline prices create a high base, and energy variables may still cause adverse effects.
Gasoline prices rose 20.5% year-on-year in June, significantly lower than May's 33.2%, and were the main source of the overall inflation slowdown. Meanwhile, gasoline prices fell 10.2% month-on-month, reflecting a decline in global oil prices following diplomatic negotiations and a temporary ceasefire. Given the high correlation between the Canadian dollar and energy terms of trade, the decline in oil prices had a dual impact: lowering Canadian inflation on the one hand, and weakening the support of energy revenues for the Canadian dollar on the other. However, the 20.5% year-on-year increase remains relatively high, indicating that energy prices have not truly entered deflation. If crude oil prices strengthen again, the gasoline component could again boost overall inflation and improve Canada's terms of trade. At that point, the Bank of Canada's easing expectations and the support of energy prices for the Canadian dollar could offset each other. This is one reason why the USD/CAD pair, although rising rapidly after the data release, failed to immediately move away from 1.4050. The market is trading on the interest rate differential changes brought about by the inflation data, but the possibility of a rebound in energy prices providing a buffer for the Canadian dollar has not been completely ruled out.The World Cup has driven up service prices, but its sustainability needs careful evaluation.
Service prices diverged significantly in June. Tourist demand driven by the World Cup boosted prices for accommodation, airfares, and car rentals. Accommodation prices rose 10.1% year-over-year, with Ontario hotel prices increasing by 19.4% and British Columbia by 20.0%. Airfares rose 9.6%, while car rentals and tour packages both increased by 6.8%. These price increases are strongly event-driven and do not necessarily reflect a general surge in daily consumer demand. During major sporting events, the supply elasticity of hotel rooms, flight seats, and rental vehicles is limited, and concentrated short-term demand can easily lead to significant price premiums. Whether these prices can be maintained after the events will determine whether service inflation is truly sticky. Regional data also supports this assessment. Except for Prince Edward Island, inflation in all provinces slowed compared to May. Ontario had the lowest inflation rate at 2.0%, mainly due to a slowdown in restaurant price growth; Nova Scotia had the highest inflation rate at 4.7%, with accommodation prices being the primary driver. Inter-provincial differences stem more from tourism activities and energy consumption than from a nationwide surge in demand.The USD/CAD pair broke through the upper Bollinger Band, and short-term pricing is now in a confirmation phase.
Looking at the 60-minute chart, the USD/CAD pair has rebounded steadily from around 1.4002, breaking through the 1.4022 and 1.4030 areas before quickly rising to 1.4051. The latest quote of 1.4045 is higher than the Bollinger Band middle line at 1.4017 and slightly higher than the upper line at 1.4040, indicating that inflation data has driven the exchange rate into a short-term expansion phase. The MACD indicator's fast line rose to 0.0004, while the slow line remained around -0.0001, and the histogram expanded to 0.0010, reflecting strengthening upward momentum. However, a long upper shadow appeared near 1.4051, followed by a significant reduction in the candlestick body, indicating that the price encountered some selling pressure after breaking through the upper Bollinger Band. Therefore, the 1.4040 to 1.4051 range has become a key area for the market to test the sustainability of the data's impact.
- Risk Warning and Disclaimer
- The market involves risk, and trading may not be suitable for all investors. This article is for reference only and does not constitute personal investment advice, nor does it take into account certain users’ specific investment objectives, financial situation, or other needs. Any investment decisions made based on this information are at your own risk.