Shipping crisis drives up oil prices; 14-year high interest rates weigh on gold prices.
2026-07-24 17:56:04
On Friday (July 24), spot gold prices rebounded slightly during the Asian and European sessions, remaining almost unchanged from the previous day's closing price, currently trading around 4049. The geopolitical confrontation between the US and Iran continues to escalate, with the US launching its thirteenth consecutive nighttime airstrike on multiple military, energy, and nuclear-related targets within Iran, completing multiple rounds of attacks. Bahrain has repeatedly sounded air raid sirens to warn of incoming fire. As the rivalry intensifies, Iran firmly controls the shipping lanes in the Strait of Hormuz, while its supported Houthi rebels in Yemen continue to attack merchant ships and oil tankers in the Red Sea and the Bab el-Mandeb Strait, paralyzing two major global energy shipping routes simultaneously. This high level of regional shipping risk directly pushed Brent crude oil prices up again yesterday, exceeding $100 per barrel, leading to a significant adjustment in the global energy trade landscape. Although Iran still bombed an oil tanker yesterday despite Trump's threat to bomb a bridge in return, the US's direct bombing of purely civilian power plants and bridges is highly controversial under international law and could easily trigger accusations of "war crimes" from the international community. The U.S. military conducted a “precise risk assessment” when selecting targets, concluding that cutting off Iran’s funding through sanctions and coordinating with precision strikes against Revolutionary Guard military nodes was more beneficial to the current strategic situation than directly paralyzing civilian infrastructure. 
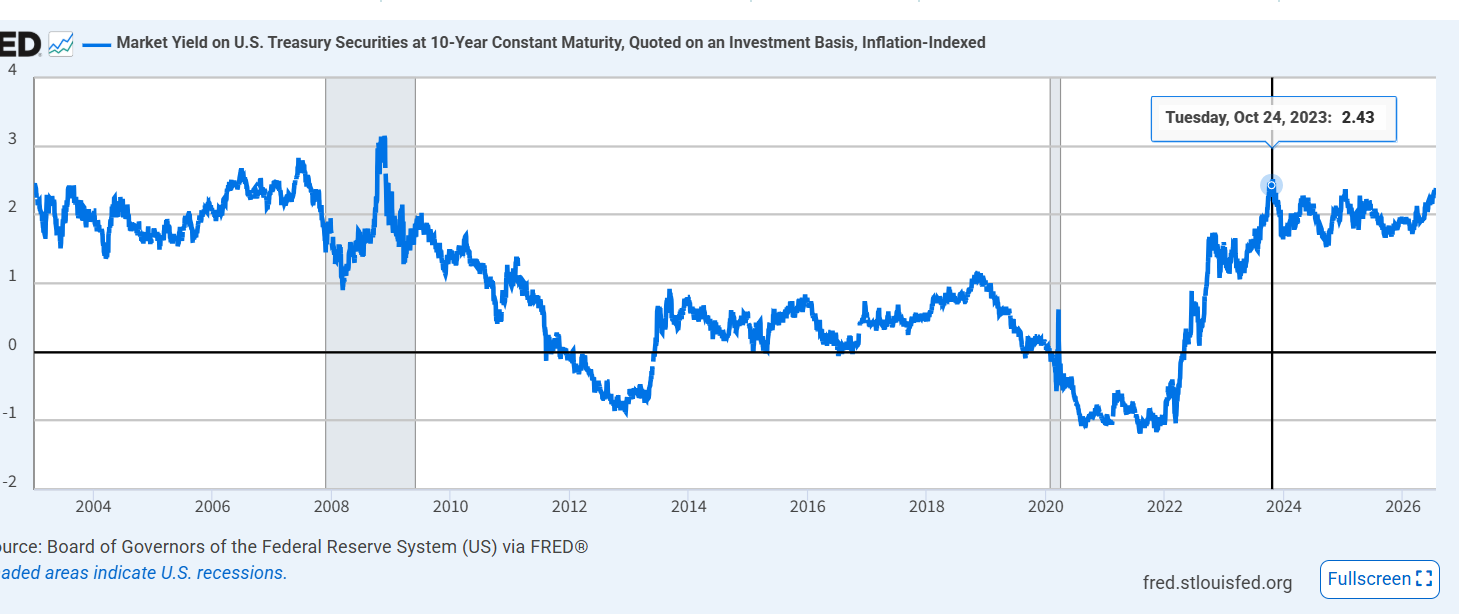 (Chart of US inflation-hedging bond yields, source: Federal Reserve)
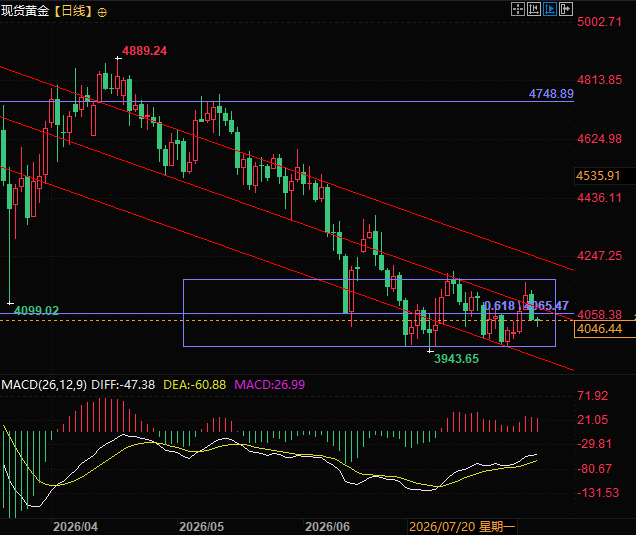 (Spot gold daily chart, source: EasyTrade) At 16:15 Beijing time, spot gold is currently trading at $4046 per ounce.
Navigation on key shipping routes has plummeted, bringing the Middle East crude oil transportation system to the brink of collapse.
Traffic in the Strait of Hormuz, a key global energy transport hub, has plummeted. Data from Kpler, a commodity shipping data agency, shows that only one oil tanker transited the strait on July 23, the lowest level since May 7, while only three ships passed the previous day. As a strategic waterway carrying one-fifth of global oil and gas transport, the near-total halt in the Strait of Hormuz has completely disrupted the traditional export schedule for Middle Eastern crude oil. Meanwhile, the Bab el-Mandeb Strait has been completely blocked by ongoing attacks from the Houthi rebels, severing Saudi Arabia's traditional shipping route from Yanbu port on the Red Sea southward through the Bab el-Mandeb Strait to the Indian Ocean for shipments to key Asian markets such as China, Japan, and South Korea. This conventional route, which takes only 19 days (currently 48 days) , is the optimal shortcut for Saudi crude oil exports. The failure of these two crucial shipping routes has forced Saudi Arabia to urgently adjust its transportation plans.Forced to take ultra-longer detours, Saudi Arabia's crude oil export costs and timelines have increased significantly.
A common question in the market is: given that the Suez Canal connects the Red Sea and the Mediterranean Sea, why does Saudi Arabia still need to detour around the Cape of Good Hope after transiting the canal? The core reason is that Saudi Arabia's main oil consumption market is in Asian countries, not Europe. The Mediterranean Sea does not directly connect to the Indian Ocean, thus preventing direct access to Asian markets. Affected by the dual shipping route crisis, Saudi Arabia has been forced to adopt an extremely long detour: north from Yanbu Port → Suez Canal → Mediterranean Sea → Strait of Gibraltar → Atlantic Ocean → Cape of Good Hope → Indian Ocean → Asian markets. Because of this detour, the voyage time has increased dramatically from 19 days to 48 days, resulting in a significant drop in transportation efficiency. Cost pressures have also risen significantly , with ship fuel costs doubling from $1.26 million to $2.87 million. Combined with the approximately $1 million Suez Canal passage fee, the cost per ship has skyrocketed. Furthermore, Suez Canal restrictions require very large crude carriers (VLCCs) to pass half-load, further reducing shipping capacity. Although Saudi Arabia relies on the Sumaid pipeline to divert transport capacity, which has a daily oil transport capacity of 2.5 million barrels, this is far lower than its total daily crude oil exports of 7 million barrels, making it difficult to alleviate the overall transport capacity bottleneck.The market proactively mitigates risks, and the first-ever direct flight route from Egypt to South Korea's VLCCs has been launched.
With traditionally high-risk shipping routes in the Middle East severely restricted, the shipping market is proactively restructuring global crude oil transportation chains, giving rise to unprecedented new inter-regional routes. Charter party documents show that a Very Large Crude Carrier (VLCC) has secured a contract, marking the first-ever direct crude oil transportation route from Egypt to South Korea. The specific schedule is as follows: the DHT Stallion will load cargo at the port of Sidi Kirill in Egypt from August 18th to 20th, and then proceed directly to the port of Ulsan in South Korea for unloading. According to Kpler's complete shipping database since 2008, this shipment is the first inter-regional VLCC transport order on this route, fully reflecting the market's extreme aversion to the geopolitical shipping risks in the Middle East.US Treasury real yields jumped sharply to a near 14-year high.
Amid geopolitical crises driving up oil prices and fueling inflation concerns, while simultaneously stirring up risk aversion in the market, US macroeconomic interest rate data saw a significant breakthrough, exerting strong constraints on the performance of major asset classes. On July 23, the latest auction of US 10-year Treasury Inflation-Protected Securities (TIPS) was completed, with the core real interest rate jumping sharply: the previous auction rate was 2.17%, which climbed directly to 2.44% , a new high in nearly 14 years, second only to the interest rate level during the 2008 subprime mortgage crisis. This signifies a significant increase in global real financing costs and the opportunity cost of holding low-interest or non-interest-bearing assets. (Chart of US inflation-hedging bond yields, source: Federal Reserve)Geopolitical risk aversion versus interest rate suppression: the core game in gold price movements.
From the perspective of gold pricing logic, the current market presents a fierce battle between bulls and bears. On the one hand, the ongoing US-Iran standoff and the escalating global energy shipping crisis are driving up global interest rates. On the other hand, the relatively restrained US military has lessened market pessimism. As a result, the real interest rate, a core pricing factor for gold, has risen sharply, continuously suppressing the upside potential of gold prices. Gold is a non-interest-bearing safe-haven asset with no continuous cash flow returns . The rise in real interest rates directly increases the opportunity cost of holding gold, prompting market funds to flow back to high-yield US Treasury assets. Currently, the real interest rate, at a 14-year high, is creating strong bearish pressure, offsetting the positive effects of geopolitical safe-haven demand and becoming the core obstacle to a sustained rise in gold prices. The future trend of gold prices is highly dependent on the inflection point of US real interest rates. This inflection point is closely related to the US-Iran military conflict and the passage of oil tankers through the two energy straits. Technical Analysis: Spot gold shows signs of entering a range-bound trading pattern. Closely monitor the strength of the price action around 4065. Currently, the price is still under pressure from the 50% Fibonacci retracement level (also a key 0.618 Fibonacci level) and the descending channel, indicating a bearish bias. (Spot gold daily chart, source: EasyTrade) At 16:15 Beijing time, spot gold is currently trading at $4046 per ounce.
- Risk Warning and Disclaimer
- The market involves risk, and trading may not be suitable for all investors. This article is for reference only and does not constitute personal investment advice, nor does it take into account certain users’ specific investment objectives, financial situation, or other needs. Any investment decisions made based on this information are at your own risk.