Gold Price Outlook: Can Quiet Accumulation Trigger a Price Breakout?
2026-08-04 19:16:51
Since hitting a record high in January, gold prices have fallen by nearly 30%, but bulls have consistently held the support level around $4,000. Although the overall trend remains bearish, improved futures positioning, warming sentiment in the options market, and positive price signals suggest that the market may be quietly accumulating positions, and there is a possibility that gold prices may break out upwards.  Quiet Accumulation, Poised for a Gold Breakout Since reaching a previous all-time high in January, gold prices, denominated in US dollars, have fallen by nearly a third. The overall downtrend remains firm, but since the end of June, bulls have shown remarkable resilience in defending the 4000 level. This raises the question: is the bears merely taking a short break, waiting for a downward breakout from the typical trend consolidation pattern; or is a bullish breakout imminent? This article leans towards the latter. Gold Futures and Options Show Signs of Mild Accumulation The weekly gold chart shows that while gold prices have been oscillating sideways within a range for the past few weeks, subtle signals of quiet accumulation by bulls have emerged. The risk reversal indicator continues to rise, meaning that demand for call options exceeds demand for put options. In other words, even though gold prices have failed to decline, market demand for downside hedging put options has cooled. Furthermore, since the end of April, asset management institutions' net long positions in gold have generally trended upward. Admittedly, this position narrowed slightly last week, and large speculators have also reduced their long positions over the past three weeks. However, overall, bullish sentiment among gold futures traders has increased compared to two months ago. Bulls are holding firm on the $4000 level, and momentum indicators are showing marginal improvement.
 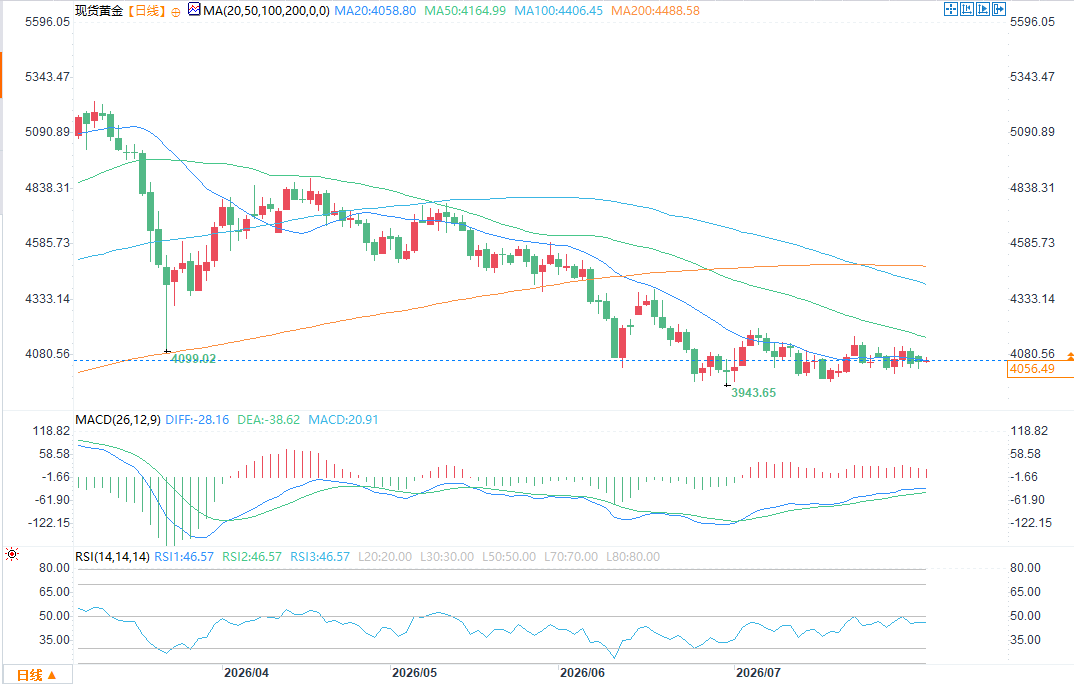 (Spot Gold Daily Chart Source: FX678) The daily chart shows a significant upward gap from around 4000, the closing price on Wednesday. Prior to this gap, gold had repeatedly failed to break below the 4000 level, indicating that gold bulls are quietly accumulating positions near the lows of this cycle. On the hourly chart, gold is currently experiencing a slight pullback, forming a double bottom pattern above the gap support. Gold is currently attempting to break through the monthly pivot point, with the bulls targeting 4200. If the US dollar weakens along with the Japanese yen in the coming weeks, gold is expected to break through the first monthly resistance level R1 and further challenge the 200-day exponential moving average (EMA) around 4300.
Quiet Accumulation, Poised for a Gold Breakout Since reaching a previous all-time high in January, gold prices, denominated in US dollars, have fallen by nearly a third. The overall downtrend remains firm, but since the end of June, bulls have shown remarkable resilience in defending the 4000 level. This raises the question: is the bears merely taking a short break, waiting for a downward breakout from the typical trend consolidation pattern; or is a bullish breakout imminent? This article leans towards the latter. Gold Futures and Options Show Signs of Mild Accumulation The weekly gold chart shows that while gold prices have been oscillating sideways within a range for the past few weeks, subtle signals of quiet accumulation by bulls have emerged. The risk reversal indicator continues to rise, meaning that demand for call options exceeds demand for put options. In other words, even though gold prices have failed to decline, market demand for downside hedging put options has cooled. Furthermore, since the end of April, asset management institutions' net long positions in gold have generally trended upward. Admittedly, this position narrowed slightly last week, and large speculators have also reduced their long positions over the past three weeks. However, overall, bullish sentiment among gold futures traders has increased compared to two months ago. Bulls are holding firm on the $4000 level, and momentum indicators are showing marginal improvement. (Spot Gold Daily Chart Source: FX678) The daily chart shows a significant upward gap from around 4000, the closing price on Wednesday. Prior to this gap, gold had repeatedly failed to break below the 4000 level, indicating that gold bulls are quietly accumulating positions near the lows of this cycle. On the hourly chart, gold is currently experiencing a slight pullback, forming a double bottom pattern above the gap support. Gold is currently attempting to break through the monthly pivot point, with the bulls targeting 4200. If the US dollar weakens along with the Japanese yen in the coming weeks, gold is expected to break through the first monthly resistance level R1 and further challenge the 200-day exponential moving average (EMA) around 4300.
- Risk Warning and Disclaimer
- The market involves risk, and trading may not be suitable for all investors. This article is for reference only and does not constitute personal investment advice, nor does it take into account certain users’ specific investment objectives, financial situation, or other needs. Any investment decisions made based on this information are at your own risk.