Gold prices strengthened, driven by expectations of an Iran deal and declining US Treasury yields.
2026-08-05 02:18:51
On Tuesday (August 4), spot gold was trading at $4,087.4 per ounce, up about 0.79%, while crude oil prices and US Treasury yields declined in tandem. Meanwhile, improved market risk appetite pushed gold prices up to $4,106 per ounce, a two-day high.  Spot gold rose as expectations of the Strait of Hormuz reopening weighed on oil prices and eased inflationary pressures. The US dollar index (DXY) fell 0.05%, as the market increasingly anticipated the reopening of the Strait of Hormuz. According to the Islamic Republic of Iran Broadcasting (IRNA), an Iranian Foreign Ministry spokesperson recently stated that Iran and Oman are still negotiating on the Strait of Hormuz issue. Reports also indicated that Tehran is considering allowing European countries to conduct mine-clearing operations in the strait. US President Trump retweeted an August 2nd article titled "Trump: US-Iran Denuclearization Talks Resume Monday, Agreement Imminent." The US June Job Openings and Labor Turnover Survey (JOLTS) fell to 7.359 million from 7.537 million, below market expectations of 7.4 million. The low level of layoffs indicates relatively subdued corporate layoffs and hiring activity, with the number of unemployed roughly equal to the number of job openings, reflecting an overall balanced labor market. The US Commerce Department reported that the trade deficit narrowed to $73.3 billion in June from $77.6 billion, slightly higher than the expected $73 billion. The market is currently focused on the July ADP employment data, with expectations of 70,000 new private sector jobs, lower than June's 98,000. The focus will then shift to Thursday's initial jobless claims data, followed by the July non-farm payrolls report, with the market expecting 80,000 new jobs added in the US economy. It's worth noting that if oil prices continue to fall sharply, gold prices could rise further. US benchmark West Texas Intermediate (WTI) crude oil fell nearly 5% to $76.09 per barrel; market expectations of weaker inflation data drove down US Treasury yields. The yield on the 10-year US Treasury note fell 10 basis points to 4.687%. PrimeTerminal data shows that money market pricing indicates a near 59% probability of a rate hike at the Fed's September 16 meeting and an 83% probability at the December meeting. In addition, New York Fed President John Williams expressed optimism on Monday, believing that inflationary pressures will gradually subside. However, he also emphasized that if inflation fails to cool as expected, the Fed is prepared to respond by raising interest rates. Spot gold technical analysis: Overall, the outlook remains bearish, but the price of gold is expected to break through $4,100.
 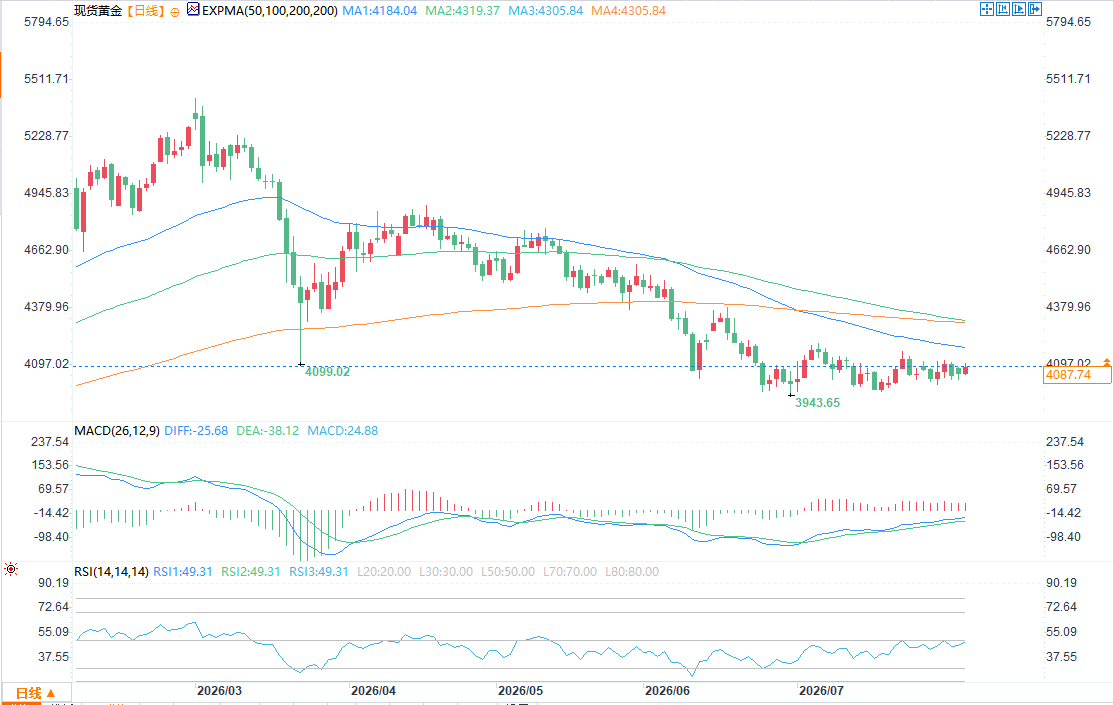 (WTI crude oil daily chart source: EasyForex) Gold prices are in a consolidation phase, approaching the $4100 mark for the first time since last Friday. The Relative Strength Index (RSI) indicates that bullish momentum is building, and the indicator is about to break above the 50 neutral line, which some traders are taking as a buy signal for gold. Even so, the market structure still maintains a bearish pattern with lower highs and lower lows. However, if spot gold breaks above the 50-day simple moving average of $4156 and further rises above the July 6 cycle high of $4202, the trend will turn neutral to bullish. To continue the bearish trend, gold prices need to break below the intraday low of $4019 on August 3. Once this level is breached, it will test the $4000 psychological level, followed by the June 17 low of $3959.
Spot gold rose as expectations of the Strait of Hormuz reopening weighed on oil prices and eased inflationary pressures. The US dollar index (DXY) fell 0.05%, as the market increasingly anticipated the reopening of the Strait of Hormuz. According to the Islamic Republic of Iran Broadcasting (IRNA), an Iranian Foreign Ministry spokesperson recently stated that Iran and Oman are still negotiating on the Strait of Hormuz issue. Reports also indicated that Tehran is considering allowing European countries to conduct mine-clearing operations in the strait. US President Trump retweeted an August 2nd article titled "Trump: US-Iran Denuclearization Talks Resume Monday, Agreement Imminent." The US June Job Openings and Labor Turnover Survey (JOLTS) fell to 7.359 million from 7.537 million, below market expectations of 7.4 million. The low level of layoffs indicates relatively subdued corporate layoffs and hiring activity, with the number of unemployed roughly equal to the number of job openings, reflecting an overall balanced labor market. The US Commerce Department reported that the trade deficit narrowed to $73.3 billion in June from $77.6 billion, slightly higher than the expected $73 billion. The market is currently focused on the July ADP employment data, with expectations of 70,000 new private sector jobs, lower than June's 98,000. The focus will then shift to Thursday's initial jobless claims data, followed by the July non-farm payrolls report, with the market expecting 80,000 new jobs added in the US economy. It's worth noting that if oil prices continue to fall sharply, gold prices could rise further. US benchmark West Texas Intermediate (WTI) crude oil fell nearly 5% to $76.09 per barrel; market expectations of weaker inflation data drove down US Treasury yields. The yield on the 10-year US Treasury note fell 10 basis points to 4.687%. PrimeTerminal data shows that money market pricing indicates a near 59% probability of a rate hike at the Fed's September 16 meeting and an 83% probability at the December meeting. In addition, New York Fed President John Williams expressed optimism on Monday, believing that inflationary pressures will gradually subside. However, he also emphasized that if inflation fails to cool as expected, the Fed is prepared to respond by raising interest rates. Spot gold technical analysis: Overall, the outlook remains bearish, but the price of gold is expected to break through $4,100. (WTI crude oil daily chart source: EasyForex) Gold prices are in a consolidation phase, approaching the $4100 mark for the first time since last Friday. The Relative Strength Index (RSI) indicates that bullish momentum is building, and the indicator is about to break above the 50 neutral line, which some traders are taking as a buy signal for gold. Even so, the market structure still maintains a bearish pattern with lower highs and lower lows. However, if spot gold breaks above the 50-day simple moving average of $4156 and further rises above the July 6 cycle high of $4202, the trend will turn neutral to bullish. To continue the bearish trend, gold prices need to break below the intraday low of $4019 on August 3. Once this level is breached, it will test the $4000 psychological level, followed by the June 17 low of $3959.
- Risk Warning and Disclaimer
- The market involves risk, and trading may not be suitable for all investors. This article is for reference only and does not constitute personal investment advice, nor does it take into account certain users’ specific investment objectives, financial situation, or other needs. Any investment decisions made based on this information are at your own risk.