What has been the effect of this round of yen intervention?
2026-08-05 21:34:52
Over the past week, the Japanese and US governments have launched a truly aggressive crackdown on the markets. Large-scale actual intervention occurred in the foreign exchange market, while verbal intervention continued unabated, with US Treasury Secretary Bessenter particularly vocal in his attempts to push up the yen.  Logically, with so many measures employed, the yen's appreciation should have exceeded the performance of the previous two rounds of intervention earlier this year, but this has not been the case. The current price movement is roughly equivalent to the interest rate test conducted by the New York Fed on January 23, just before Japan's general election on February 8. This performance is disappointing and confirms a key point: as in the past, this round of intervention is unlikely to reverse the overall trend of yen weakness.
 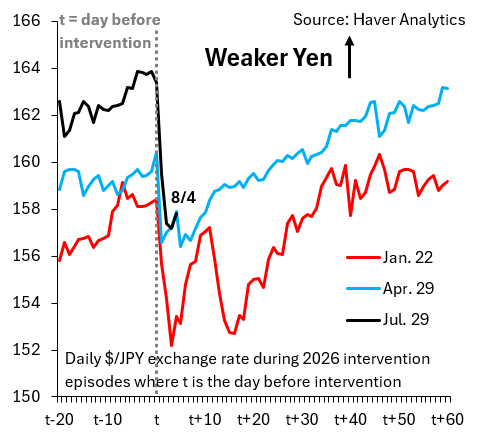 The chart above shows the daily USD/JPY exchange rate during the three rounds of intervention this year. Using an event timeline to align the data, 't' represents the day before each intervention, marked by the gray vertical dashed line. The red line represents the first round of intervention, the New York Fed's interest rate test on January 23; the blue line represents the second round, Japan's large-scale unilateral intervention on April 30; and the black line represents the current round of intervention, which began on July 30. Yesterday (August 4) is marked as 8/4 on the chart. Two key pieces of information can be gleaned from the chart: First, after each round of intervention, the central value of the USD/JPY exchange rate has consistently risen. This indicates that repeated interventions failed to stop the yen's depreciation, confirming a core judgment—intervention cannot prevent the yen's decline. Second, although the absolute value of the current USD/JPY decline appears large, it's important to note that the starting exchange rate for this round of movement was already at a higher level. Standardization and comparison will be performed below.
 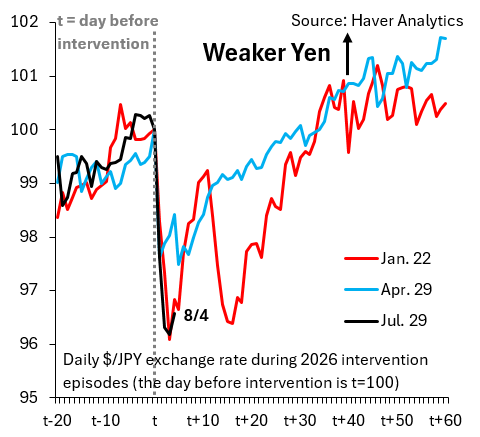 The second chart is structurally identical to the first, the difference being that the USD/JPY exchange rate on the day before each round of intervention is standardized and assigned a value of 100. After standardization, it can be seen that the current decline in USD/JPY, and the recent rebound, are almost identical to the one in January. This round, the US and Japan have used almost all available means to intervene in the market, but the market performance has been limited. In my view, the result is far below expectations, further supporting the view that, like all previous interventions, this round of intervention cannot reverse the trend of yen depreciation.
Logically, with so many measures employed, the yen's appreciation should have exceeded the performance of the previous two rounds of intervention earlier this year, but this has not been the case. The current price movement is roughly equivalent to the interest rate test conducted by the New York Fed on January 23, just before Japan's general election on February 8. This performance is disappointing and confirms a key point: as in the past, this round of intervention is unlikely to reverse the overall trend of yen weakness. The chart above shows the daily USD/JPY exchange rate during the three rounds of intervention this year. Using an event timeline to align the data, 't' represents the day before each intervention, marked by the gray vertical dashed line. The red line represents the first round of intervention, the New York Fed's interest rate test on January 23; the blue line represents the second round, Japan's large-scale unilateral intervention on April 30; and the black line represents the current round of intervention, which began on July 30. Yesterday (August 4) is marked as 8/4 on the chart. Two key pieces of information can be gleaned from the chart: First, after each round of intervention, the central value of the USD/JPY exchange rate has consistently risen. This indicates that repeated interventions failed to stop the yen's depreciation, confirming a core judgment—intervention cannot prevent the yen's decline. Second, although the absolute value of the current USD/JPY decline appears large, it's important to note that the starting exchange rate for this round of movement was already at a higher level. Standardization and comparison will be performed below. The second chart is structurally identical to the first, the difference being that the USD/JPY exchange rate on the day before each round of intervention is standardized and assigned a value of 100. After standardization, it can be seen that the current decline in USD/JPY, and the recent rebound, are almost identical to the one in January. This round, the US and Japan have used almost all available means to intervene in the market, but the market performance has been limited. In my view, the result is far below expectations, further supporting the view that, like all previous interventions, this round of intervention cannot reverse the trend of yen depreciation.
- Risk Warning and Disclaimer
- The market involves risk, and trading may not be suitable for all investors. This article is for reference only and does not constitute personal investment advice, nor does it take into account certain users’ specific investment objectives, financial situation, or other needs. Any investment decisions made based on this information are at your own risk.