After four consecutive days of gold price increases, what real information are revealed by technical indicators?
2026-08-06 15:14:54
On Thursday, August 6th, spot gold rose for the fourth consecutive trading day, briefly climbing above $4,300 per ounce during Asian trading hours, reaching a roughly seven-week high. The previous trading day saw gold prices rise by more than 4%, with a weaker dollar, falling bond yields, and declining energy prices all contributing to a reassessment of gold's macroeconomic pricing. Meanwhile, Federal Reserve officials continued to emphasize inflation risks, creating a complex and nuanced market environment: cautious policy statements, somewhat cooling interest rate expectations, but no comprehensive easing of actual financial conditions. 
 Furthermore, large single-day fluctuations significantly amplify the true volatility and make Bollinger Bands, momentum indicators, and short-term moving averages more sensitive to new market movements. Going forward, key technical observations will focus on whether volatility gradually converges, whether the trading center of gravity stabilizes, and whether the middle Bollinger Band slope and the MACD slow line show sustained changes. At 15:11 Beijing time, spot gold was trading at $4261 per ounce.
The core variable driving the gold rebound has shifted.
Previously, gold faced significant pressure from rising energy prices, warming inflation expectations, and increased real yields. Since gold itself doesn't generate interest, the opportunity cost of holding gold typically rises when real bond returns increase significantly. Recent market movements indicate that a weaker dollar and declining nominal yields are easing this pressure, shifting the short-term pricing focus of gold from a single interest rate factor to the combined effect of the dollar, energy prices, and policy expectations. The 10-year US Treasury yield has fallen from around 4.75% recently to around 4.60%, and market expectations for a September rate hike by the Federal Reserve have also declined from higher levels. Falling oil prices have alleviated concerns about further spread of energy inflation, preventing the market from pricing solely around the assumption that "high inflation inevitably corresponds to higher interest rates." This does not mean that inflationary constraints have disappeared. The Federal Reserve's July monetary policy report indicated that the personal consumption expenditure price index rose 4.1% year-on-year as of May, significantly higher than the long-term target of 2%; short-term inflation expectations were affected by the energy shock, but long-term expectations generally remain within the common range of the past decade. Policy therefore faces a dual constraint: preventing short-term price pressures from solidifying while avoiding an excessive shock to already cooling demand.Cooling policy expectations does not equate to a shift in policy stance.
The Federal Reserve's current target range for the federal funds rate remains at 3.50% to 3.75%. The latest official statements continue to describe inflation as above target and emphasize the responsibility for price stability. Some officials have recently stated that they are prepared to support further interest rate hikes if inflation does not moderate sustainably. Therefore, the recent rebound in gold prices reflects more of a market repricing of the probability of interest rate hikes, the strength of the dollar, and the yield curve, rather than a clear shift towards easing monetary policy. It is worth noting that while long-term inflation expectations in financial markets are relatively stable, households and businesses are more sensitive to recent price pressures. When these two sets of expectations diverge, policy communication becomes significantly more difficult. If policymakers emphasize stable long-term expectations, the market may lower its expectations for consecutive interest rate hikes; however, if actual inflation, wages, and service prices remain persistently high, the yield curve may re-induce additional tightening risks.Reserve demand provides structural support to the market.
Gold's medium- to long-term pricing is not entirely dependent on short-term interest rates. A June survey by the World Gold Council showed that 89% of surveyed reserve managers expect global central bank gold reserves to continue increasing over the next 12 months, and 45% plan to increase their institutions' gold holdings, the highest percentage since the survey began. Reserve allocation typically features long cycles, low turnover rates, and relatively limited price sensitivity, thus reducing the gold market's complete dependence on short-term capital flows. This structural demand does not necessarily mean a decrease in gold volatility. Macroeconomic funds will continue to rapidly adjust their exposure around the US dollar, real yields, energy prices, and policy meetings. Reserve demand is closer to the underlying liquidity sources in the market, while short-term prices may still be amplified by futures positions, options hedging, and event risk.The technical structure shows that the fluctuation state is rapidly escalating.
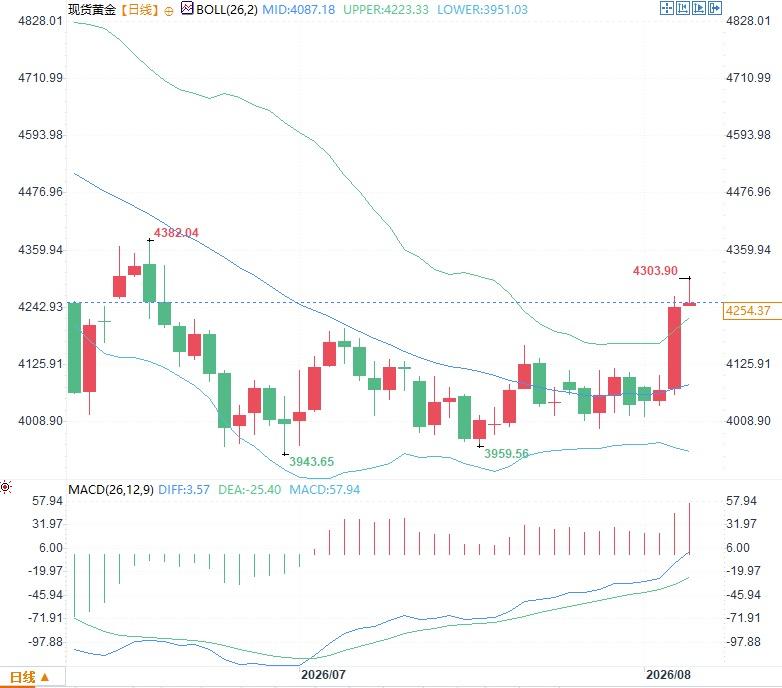
The daily chart shows that gold had been trading below the Bollinger Band's middle band for an extended period. After consolidating at lower levels, a large bullish candlestick appeared, with the price quickly breaking through the middle band and touching the outer edge of the upper band. The MACD histogram has expanded significantly, with the fast line crossing above the zero line, but the slow line remains in negative territory. This combination reflects a rapid improvement in short-term momentum, while medium-term trend indicators have not yet completed a synchronized correction. The time lag between price, moving averages, and momentum indicators suggests that the current phase is more accurately defined as a period of volatility expansion and structural reassessment, rather than a fully confirmed stable trend. Furthermore, large single-day fluctuations significantly amplify the true volatility and make Bollinger Bands, momentum indicators, and short-term moving averages more sensitive to new market movements. Going forward, key technical observations will focus on whether volatility gradually converges, whether the trading center of gravity stabilizes, and whether the middle Bollinger Band slope and the MACD slow line show sustained changes. At 15:11 Beijing time, spot gold was trading at $4261 per ounce.
- Risk Warning and Disclaimer
- The market involves risk, and trading may not be suitable for all investors. This article is for reference only and does not constitute personal investment advice, nor does it take into account certain users’ specific investment objectives, financial situation, or other needs. Any investment decisions made based on this information are at your own risk.