Gold prices remained stable as expectations of a Fed rate hike and the ongoing Middle East situation continued to weigh on the market.
2026-08-11 00:56:54
On Monday (August 10), spot gold's upward momentum slowed, with bulls taking a breather after last week's sharp rise in prices; the market's main focus remained on the Federal Reserve's interest rate outlook and the geopolitical situation in the Middle East. It traded around $4352.71 during the session, reaching a daily high of $4364.83.  Last week, the precious metal saw a cumulative increase of over 7%, reaching a new high since June 17th on Friday. The core driver of this surge was weaker-than-expected US non-farm payroll data (NFP), leading the market to significantly lower its expectations for a Fed rate hike and shift towards pricing in further easing. Simultaneously, news emerged that Iran and Oman were close to finalizing an agreement to restore navigation through the Strait of Hormuz, causing international oil prices to fall and inflation concerns to ease. These two factors combined to pressure the dollar and US Treasury yields; however, oil prices remain significantly higher than pre-conflict levels, and energy inflation concerns have not been completely eliminated, thus limiting the downside potential for the dollar and US Treasury yields. The US Dollar Index (DXY) has bottomed out near a two-month low and is currently trading at 99.70, up slightly by 0.10% on the day; the benchmark 10-year US Treasury yield is hovering around 4.67%, lower than the previous peak of 4.74% (the highest level since January 2025). Data from the CME FedWatch Tool shows that the market is currently pricing in only a 44% probability of a rate hike at the September FOMC meeting, compared to 67% a week ago. Market attention has now shifted to Wednesday's US Consumer Price Index (CPI) and Thursday's Producer Price Index (PPI). Traders will be looking for new clues about the Fed's interest rate policy through these two sets of inflation data, and the data performance may dominate the subsequent price movements of the dollar and gold. Strategists at Brown Brothers Harriman (BBH) analyzed that the upcoming US inflation data carries a greater risk of being bearish for the dollar overall. The bank noted, "If the CPI data weakens, the market will further ease pricing in Fed rate hike expectations, putting increased pressure on the dollar; if the CPI data is significantly higher than expected, a short-term surge in yields may lead to a short-term impulsive rebound in the dollar." However, BBH also cautioned against the risk that the Fed's current monetary policy is already in a restrictive range (assuming a neutral interest rate of 3.00%), and the market has very limited room to significantly raise its rate hike expectations. This fundamental factor will continue to put downward pressure on the dollar. Geopolitical Situation: US President Trump stated that the US is conducting "semi-formal consultations" with Iran while maintaining a low profile regarding military action against Iran; however, Iran denies having direct negotiations with the US. Iranian Foreign Ministry spokesman Esmaeil Baghaei stated that navigation in the Strait of Hormuz is safe only if the US ceases military strikes and compensates for damages caused by past attacks. Technical Analysis: Strong upward momentum; gold maintains a bullish trend .
 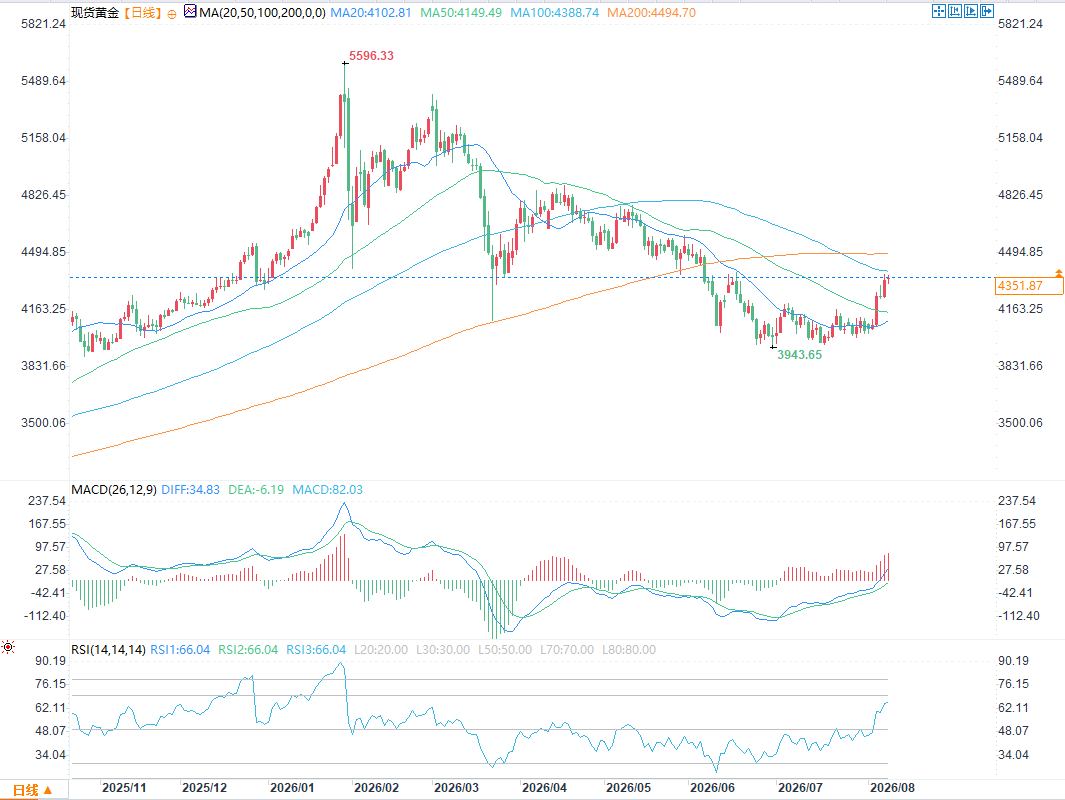 (Spot Gold Daily Chart Source: FX678) Spot gold has stabilized above the 50-day Simple Moving Average (SMA, $4149.48), maintaining a healthy bullish structure. However, the price remains capped by the 100-day SMA ($4388.74), and the overall trend is in a corrective upward cycle. The daily Relative Strength Index (RSI) is at 66.02, remaining within the 66 range, indicating strong upward momentum but not yet entering overbought territory. The MACD indicator shows a DIFF value of 34.80 and a DEA value of -6.19, with the red bars continuing to expand, indicating continued strengthening bullish momentum. Resistance Levels The first immediate resistance is the 100-day SMA at $4388.74; the key resistance zone above is at $4494.70 (200-day moving average), with a higher medium-term strong resistance at the historical high of $5596.33. The current price of $4351.81 has limited downside potential from the 100-day moving average resistance. Support Levels The first support level is the 50-day SMA at $4149.48; a stronger support zone is located at the current low of $3943.65. If gold prices break below $3943.65, the current bullish trend will collapse, and gold prices will begin a deep correction. Supplementary Trend Indicators Chart Moving Average Structure: The short-term 20-day moving average (MA20) at $4102.80 forms secondary support; the 200-day moving average (MA20) at $4494.70 is a strong medium- to long-term resistance level.
Last week, the precious metal saw a cumulative increase of over 7%, reaching a new high since June 17th on Friday. The core driver of this surge was weaker-than-expected US non-farm payroll data (NFP), leading the market to significantly lower its expectations for a Fed rate hike and shift towards pricing in further easing. Simultaneously, news emerged that Iran and Oman were close to finalizing an agreement to restore navigation through the Strait of Hormuz, causing international oil prices to fall and inflation concerns to ease. These two factors combined to pressure the dollar and US Treasury yields; however, oil prices remain significantly higher than pre-conflict levels, and energy inflation concerns have not been completely eliminated, thus limiting the downside potential for the dollar and US Treasury yields. The US Dollar Index (DXY) has bottomed out near a two-month low and is currently trading at 99.70, up slightly by 0.10% on the day; the benchmark 10-year US Treasury yield is hovering around 4.67%, lower than the previous peak of 4.74% (the highest level since January 2025). Data from the CME FedWatch Tool shows that the market is currently pricing in only a 44% probability of a rate hike at the September FOMC meeting, compared to 67% a week ago. Market attention has now shifted to Wednesday's US Consumer Price Index (CPI) and Thursday's Producer Price Index (PPI). Traders will be looking for new clues about the Fed's interest rate policy through these two sets of inflation data, and the data performance may dominate the subsequent price movements of the dollar and gold. Strategists at Brown Brothers Harriman (BBH) analyzed that the upcoming US inflation data carries a greater risk of being bearish for the dollar overall. The bank noted, "If the CPI data weakens, the market will further ease pricing in Fed rate hike expectations, putting increased pressure on the dollar; if the CPI data is significantly higher than expected, a short-term surge in yields may lead to a short-term impulsive rebound in the dollar." However, BBH also cautioned against the risk that the Fed's current monetary policy is already in a restrictive range (assuming a neutral interest rate of 3.00%), and the market has very limited room to significantly raise its rate hike expectations. This fundamental factor will continue to put downward pressure on the dollar. Geopolitical Situation: US President Trump stated that the US is conducting "semi-formal consultations" with Iran while maintaining a low profile regarding military action against Iran; however, Iran denies having direct negotiations with the US. Iranian Foreign Ministry spokesman Esmaeil Baghaei stated that navigation in the Strait of Hormuz is safe only if the US ceases military strikes and compensates for damages caused by past attacks. Technical Analysis: Strong upward momentum; gold maintains a bullish trend . (Spot Gold Daily Chart Source: FX678) Spot gold has stabilized above the 50-day Simple Moving Average (SMA, $4149.48), maintaining a healthy bullish structure. However, the price remains capped by the 100-day SMA ($4388.74), and the overall trend is in a corrective upward cycle. The daily Relative Strength Index (RSI) is at 66.02, remaining within the 66 range, indicating strong upward momentum but not yet entering overbought territory. The MACD indicator shows a DIFF value of 34.80 and a DEA value of -6.19, with the red bars continuing to expand, indicating continued strengthening bullish momentum. Resistance Levels The first immediate resistance is the 100-day SMA at $4388.74; the key resistance zone above is at $4494.70 (200-day moving average), with a higher medium-term strong resistance at the historical high of $5596.33. The current price of $4351.81 has limited downside potential from the 100-day moving average resistance. Support Levels The first support level is the 50-day SMA at $4149.48; a stronger support zone is located at the current low of $3943.65. If gold prices break below $3943.65, the current bullish trend will collapse, and gold prices will begin a deep correction. Supplementary Trend Indicators Chart Moving Average Structure: The short-term 20-day moving average (MA20) at $4102.80 forms secondary support; the 200-day moving average (MA20) at $4494.70 is a strong medium- to long-term resistance level.
- Risk Warning and Disclaimer
- The market involves risk, and trading may not be suitable for all investors. This article is for reference only and does not constitute personal investment advice, nor does it take into account certain users’ specific investment objectives, financial situation, or other needs. Any investment decisions made based on this information are at your own risk.