Gold: CPI data fully met expectations, so why did gold prices surge?
2026-08-13 17:56:56
On Thursday (August 13), international spot gold surged in early trading, reaching $4,450 per ounce, successfully setting a new two-month high and reaching a recent peak. After a brief surge to the high, the market quickly experienced a technical correction and profit-taking, causing gold prices to gradually fall back. During the session, gold traded in a range around $4,380 per ounce, with the battle between bulls and bears entering a brief equilibrium.  Looking back at this round of gold price increases, since the strong rebound began on August 5th, gold prices have accumulated a gain of nearly 10%, a remarkable short-term surge that has made it one of the best-performing commodities and financial markets recently. However, the most controversial and unusual aspect of this round of market activity lies in the significant divergence between fundamental data and market trends: the core US inflation data for July, released last night, precisely matched the market's previous consensus expectations, with no unexpected strength or weakness. According to the pricing logic of traditional financial markets, such predictable and fully realized economic data cannot drive gold to a strong, one-sided upward trend; it is more likely to maintain range-bound trading. Therefore, the core driver of this gold price surge is not the data itself, but rather the market's capital behavior and the reconstruction of macroeconomic expectations after the data release. Recently, the overall gold market has shown a strong pattern of "rising and falling back, high-level consolidation, and an upward trend." After rising to a two-month high of $4450 in the morning, it slightly retraced without a deep correction, which is sufficient to prove the strong resilience of the current bullish trend. Since August 5th, gold prices have risen by nearly 10%, accumulating a large amount of profit-taking in the short term. After reaching a relatively high level, this is a normal profit-taking and profit-taking phenomenon, falling within the scope of technical adjustments and not changing the overall upward trend. The most crucial anomaly in this round of gold price increases is the complete divergence between price movements and fundamental data. Yesterday's highly anticipated US July inflation report precisely matched market expectations in all its sub-indices, with no unexpected fluctuations. Specifically, the overall US CPI year-on-year growth rate fell to 3.4%, and the core CPI year-on-year growth rate dropped to 2.5%, both core inflation figures perfectly aligned with the previous predictions of major institutions and economists. From a traditional trading perspective, unbiased and unsurprising inflation data would allow the market to maintain its existing trading rhythm, preventing significant capital fluctuations and making it difficult to drive a one-sided surge in gold prices. This also means that the core driving force behind this round of gold price increases is not the change in the data itself, but rather the correction of previous pessimistic market expectations, concentrated portfolio adjustments, and the resonance of multiple positive macroeconomic factors after the data release. Three Core Logics Behind Gold Price Surge Against the Trend One of the core drivers of this rally was the reversal of previously pessimistic market expectations and the concentrated liquidation of short positions. In July, the international crude oil market experienced an extreme surge, with prices rising by a cumulative 21% throughout the month. As a key indicator and component of global inflation, the sharp rise in oil prices triggered widespread market concerns. Major trading institutions and hedge funds predicted that the surge in oil prices would continue to transmit to the end-consumer market, directly pushing up overall US inflation data, and even potentially leading to an unexpected rebound and further deterioration of inflation. Based on this pessimistic prediction, a large amount of trading capital positioned itself in advance, establishing short positions in gold as a safe haven, betting that higher inflation would force the Federal Reserve to maintain a tough stance on interest rate hikes, thereby suppressing gold prices. However, the released US inflation data did not reflect the upward pressure on inflation brought about by the surge in oil prices. Core inflation steadily declined, and overall inflation continued to cool, completely shattering the market's previous pessimistic expectations. After the expectation gap was fully realized, the massive short positions that had previously bet on skyrocketing inflation were liquidated en masse, resulting in a large-scale sell-off that directly translated into buying pressure on gold, creating a strong upward push and driving gold prices significantly higher. This became the most direct short-term trigger for this round of price increases. The core pricing logic for gold has always revolved around the Fed's monetary policy and market interest rate expectations. Following the release of the inflation data, market expectations for a rate hike cooled further, directly reducing the opportunity cost of holding gold. After the data release, the market's real-time pricing of the probability of a September Fed rate hike rapidly declined, falling sharply from 44% before the data release to 38%. This cooling of rate hike expectations completely reversed the market atmosphere of a tight short-term monetary policy. Along with the lower probability of a rate hike, the US dollar index and yields on US Treasury bonds of various maturities weakened simultaneously, creating a double positive environment for gold. Gold is a non-interest-bearing asset and does not generate any interest income. Compared to interest-bearing assets such as the US dollar and US Treasury bonds, its price movement shows a significant negative correlation with market interest rates and rate hike expectations. As market expectations for interest rate hikes cool and expectations for rate cuts gradually rise, the expected returns from holding US dollars and US Treasury bonds decrease, significantly enhancing the attractiveness of gold as a safe-haven asset and a hedge against inflation. This attracts a large influx of safe-haven and investment funds into the gold market, continuously pushing up gold prices. Global central banks' continued large-scale gold purchases are the long-term core support for this gold bull market, providing a solid bottom line and preventing a deep correction. Against the backdrop of a complex and volatile global geopolitical situation, ongoing adjustments to the international monetary system, and increased uncertainty surrounding US dollar assets, central banks worldwide have continued to increase their gold holdings, optimizing their foreign exchange reserve structures and reducing the risk of holding only US dollar assets. The People's Bank of China's gold purchases are particularly noteworthy, with July's increase in gold reserves reaching a new monthly high since October 2023, exceeding market expectations. As a long-term main force in the market, the central bank's continuous and large-scale gold purchases send a clear signal of a long-term bullish outlook on gold, effectively offsetting short-term negative market fluctuations and providing solid long-term bottom support for gold prices. This makes the current gold price rally more sustainable and stable, less prone to deep pullbacks. Potential Negative Factors to Watch Out For Although gold prices are currently rising strongly and the bullish trend is clear, overall market risks have not been completely cleared. The Federal Reserve's policy stance has not truly shifted to easing, and there are still potential negative risks suppressing gold prices. Investors should not blindly chase the highs. Looking back at the Fed's latest monetary policy, the July 29th meeting maintained the benchmark interest rate as expected, continuing the pause in rate hikes. However, the signals released at the meeting remained hawkish, and expectations of policy easing have not yet materialized. Among the 12 voting Fed officials, three still explicitly advocate for rate hikes, demonstrating significant internal policy disagreements within the Fed and that voices advocating for hawkish rate hikes have not disappeared. From an inflation fundamentals perspective, although the current US inflation level is steadily declining, it is still far above the Fed's core policy target of 2%, indicating significant inflation stickiness. Meanwhile, coupled with the continued rise in international crude oil prices in the previous period, the risk of commodity inflation transmission remains, and the risk of subsequent inflation rebound and recurrence still exists. This will continue to constrain the Federal Reserve's monetary policy easing space and exert medium- to long-term downward pressure on gold prices. Today, the market will see another important US inflation data release—the Producer Price Index (PPI). This data is a core leading indicator for predicting future inflation trends and will directly affect the short-term direction of gold prices. PPI data mainly reflects the wholesale pricing level of goods at the enterprise level, and can reflect the pressure of rising and falling production costs in advance. Price fluctuations at the production end will gradually be transmitted to the consumption end, directly predicting the trend of subsequent consumer inflation. It has important reference value for the Federal Reserve's subsequent policy decisions and is also the core indicator of today's gold market. If today's PPI data weakens, it means that the inflationary pressure on the production end continues to cool down, and the inflation on the consumption end is likely to continue its downward trend, which will further weaken the expectation of the Federal Reserve raising interest rates and continue to be bullish for gold prices. If today's PPI data strengthens significantly, it means that the inflationary pressure on the production end rebounds, which will once again awaken market concerns about the Federal Reserve restarting interest rate hikes, boosting the US dollar and US Treasury yields, and directly suppressing the gold price trend in the short term. Key gold price reference
 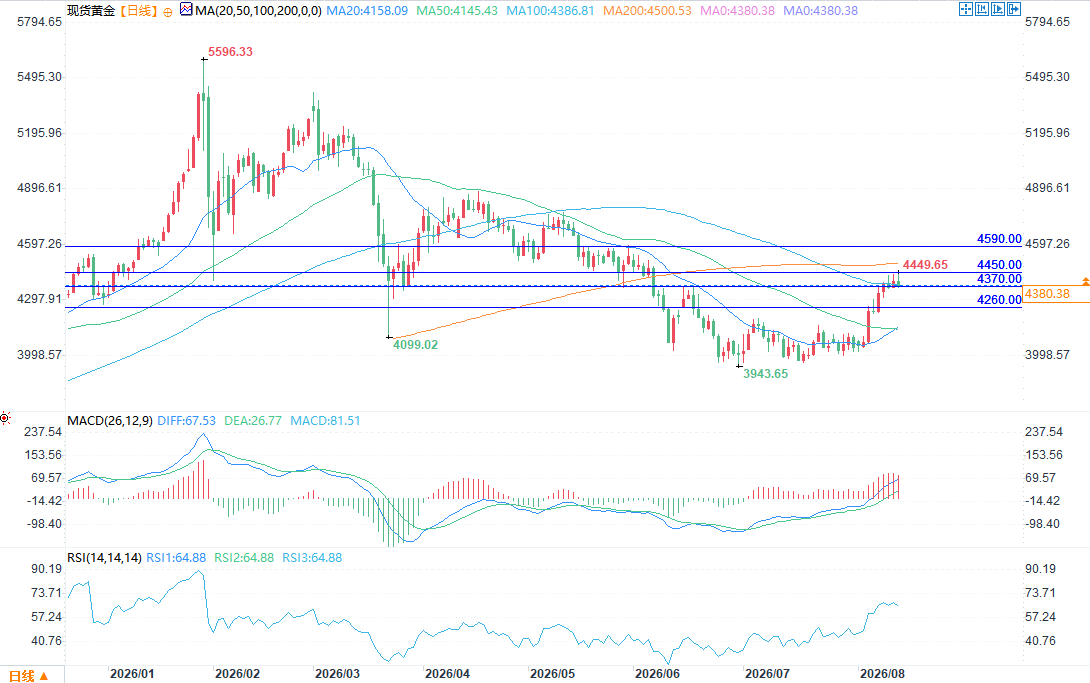 (Spot Gold Daily Chart Source: FX678) Combining the current market trend and technical patterns, the key support and resistance levels for gold are clear and can serve as core references for short-term trading. Resistance Levels: First resistance: $4450 (the intraday high, a strong short-term resistance level; a break above this level will open up new upward potential); Second resistance: $4590 (the upper edge of the previous high range, a strong medium-term resistance level). Support Levels: First support: $4370 (the short-term consolidation zone; a break below this level will initiate a technical correction); Second support: $4260 (a key support level for the current upward trend; holding this level will maintain the bullish trend). The focus going forward will be on three key variables that will directly influence gold's price movements: today's US PPI inflation data, the real-time strength of the US dollar index, and the policy decision and tone of the Federal Reserve's interest rate meeting on September 15-16.
Looking back at this round of gold price increases, since the strong rebound began on August 5th, gold prices have accumulated a gain of nearly 10%, a remarkable short-term surge that has made it one of the best-performing commodities and financial markets recently. However, the most controversial and unusual aspect of this round of market activity lies in the significant divergence between fundamental data and market trends: the core US inflation data for July, released last night, precisely matched the market's previous consensus expectations, with no unexpected strength or weakness. According to the pricing logic of traditional financial markets, such predictable and fully realized economic data cannot drive gold to a strong, one-sided upward trend; it is more likely to maintain range-bound trading. Therefore, the core driver of this gold price surge is not the data itself, but rather the market's capital behavior and the reconstruction of macroeconomic expectations after the data release. Recently, the overall gold market has shown a strong pattern of "rising and falling back, high-level consolidation, and an upward trend." After rising to a two-month high of $4450 in the morning, it slightly retraced without a deep correction, which is sufficient to prove the strong resilience of the current bullish trend. Since August 5th, gold prices have risen by nearly 10%, accumulating a large amount of profit-taking in the short term. After reaching a relatively high level, this is a normal profit-taking and profit-taking phenomenon, falling within the scope of technical adjustments and not changing the overall upward trend. The most crucial anomaly in this round of gold price increases is the complete divergence between price movements and fundamental data. Yesterday's highly anticipated US July inflation report precisely matched market expectations in all its sub-indices, with no unexpected fluctuations. Specifically, the overall US CPI year-on-year growth rate fell to 3.4%, and the core CPI year-on-year growth rate dropped to 2.5%, both core inflation figures perfectly aligned with the previous predictions of major institutions and economists. From a traditional trading perspective, unbiased and unsurprising inflation data would allow the market to maintain its existing trading rhythm, preventing significant capital fluctuations and making it difficult to drive a one-sided surge in gold prices. This also means that the core driving force behind this round of gold price increases is not the change in the data itself, but rather the correction of previous pessimistic market expectations, concentrated portfolio adjustments, and the resonance of multiple positive macroeconomic factors after the data release. Three Core Logics Behind Gold Price Surge Against the Trend One of the core drivers of this rally was the reversal of previously pessimistic market expectations and the concentrated liquidation of short positions. In July, the international crude oil market experienced an extreme surge, with prices rising by a cumulative 21% throughout the month. As a key indicator and component of global inflation, the sharp rise in oil prices triggered widespread market concerns. Major trading institutions and hedge funds predicted that the surge in oil prices would continue to transmit to the end-consumer market, directly pushing up overall US inflation data, and even potentially leading to an unexpected rebound and further deterioration of inflation. Based on this pessimistic prediction, a large amount of trading capital positioned itself in advance, establishing short positions in gold as a safe haven, betting that higher inflation would force the Federal Reserve to maintain a tough stance on interest rate hikes, thereby suppressing gold prices. However, the released US inflation data did not reflect the upward pressure on inflation brought about by the surge in oil prices. Core inflation steadily declined, and overall inflation continued to cool, completely shattering the market's previous pessimistic expectations. After the expectation gap was fully realized, the massive short positions that had previously bet on skyrocketing inflation were liquidated en masse, resulting in a large-scale sell-off that directly translated into buying pressure on gold, creating a strong upward push and driving gold prices significantly higher. This became the most direct short-term trigger for this round of price increases. The core pricing logic for gold has always revolved around the Fed's monetary policy and market interest rate expectations. Following the release of the inflation data, market expectations for a rate hike cooled further, directly reducing the opportunity cost of holding gold. After the data release, the market's real-time pricing of the probability of a September Fed rate hike rapidly declined, falling sharply from 44% before the data release to 38%. This cooling of rate hike expectations completely reversed the market atmosphere of a tight short-term monetary policy. Along with the lower probability of a rate hike, the US dollar index and yields on US Treasury bonds of various maturities weakened simultaneously, creating a double positive environment for gold. Gold is a non-interest-bearing asset and does not generate any interest income. Compared to interest-bearing assets such as the US dollar and US Treasury bonds, its price movement shows a significant negative correlation with market interest rates and rate hike expectations. As market expectations for interest rate hikes cool and expectations for rate cuts gradually rise, the expected returns from holding US dollars and US Treasury bonds decrease, significantly enhancing the attractiveness of gold as a safe-haven asset and a hedge against inflation. This attracts a large influx of safe-haven and investment funds into the gold market, continuously pushing up gold prices. Global central banks' continued large-scale gold purchases are the long-term core support for this gold bull market, providing a solid bottom line and preventing a deep correction. Against the backdrop of a complex and volatile global geopolitical situation, ongoing adjustments to the international monetary system, and increased uncertainty surrounding US dollar assets, central banks worldwide have continued to increase their gold holdings, optimizing their foreign exchange reserve structures and reducing the risk of holding only US dollar assets. The People's Bank of China's gold purchases are particularly noteworthy, with July's increase in gold reserves reaching a new monthly high since October 2023, exceeding market expectations. As a long-term main force in the market, the central bank's continuous and large-scale gold purchases send a clear signal of a long-term bullish outlook on gold, effectively offsetting short-term negative market fluctuations and providing solid long-term bottom support for gold prices. This makes the current gold price rally more sustainable and stable, less prone to deep pullbacks. Potential Negative Factors to Watch Out For Although gold prices are currently rising strongly and the bullish trend is clear, overall market risks have not been completely cleared. The Federal Reserve's policy stance has not truly shifted to easing, and there are still potential negative risks suppressing gold prices. Investors should not blindly chase the highs. Looking back at the Fed's latest monetary policy, the July 29th meeting maintained the benchmark interest rate as expected, continuing the pause in rate hikes. However, the signals released at the meeting remained hawkish, and expectations of policy easing have not yet materialized. Among the 12 voting Fed officials, three still explicitly advocate for rate hikes, demonstrating significant internal policy disagreements within the Fed and that voices advocating for hawkish rate hikes have not disappeared. From an inflation fundamentals perspective, although the current US inflation level is steadily declining, it is still far above the Fed's core policy target of 2%, indicating significant inflation stickiness. Meanwhile, coupled with the continued rise in international crude oil prices in the previous period, the risk of commodity inflation transmission remains, and the risk of subsequent inflation rebound and recurrence still exists. This will continue to constrain the Federal Reserve's monetary policy easing space and exert medium- to long-term downward pressure on gold prices. Today, the market will see another important US inflation data release—the Producer Price Index (PPI). This data is a core leading indicator for predicting future inflation trends and will directly affect the short-term direction of gold prices. PPI data mainly reflects the wholesale pricing level of goods at the enterprise level, and can reflect the pressure of rising and falling production costs in advance. Price fluctuations at the production end will gradually be transmitted to the consumption end, directly predicting the trend of subsequent consumer inflation. It has important reference value for the Federal Reserve's subsequent policy decisions and is also the core indicator of today's gold market. If today's PPI data weakens, it means that the inflationary pressure on the production end continues to cool down, and the inflation on the consumption end is likely to continue its downward trend, which will further weaken the expectation of the Federal Reserve raising interest rates and continue to be bullish for gold prices. If today's PPI data strengthens significantly, it means that the inflationary pressure on the production end rebounds, which will once again awaken market concerns about the Federal Reserve restarting interest rate hikes, boosting the US dollar and US Treasury yields, and directly suppressing the gold price trend in the short term. Key gold price reference (Spot Gold Daily Chart Source: FX678) Combining the current market trend and technical patterns, the key support and resistance levels for gold are clear and can serve as core references for short-term trading. Resistance Levels: First resistance: $4450 (the intraday high, a strong short-term resistance level; a break above this level will open up new upward potential); Second resistance: $4590 (the upper edge of the previous high range, a strong medium-term resistance level). Support Levels: First support: $4370 (the short-term consolidation zone; a break below this level will initiate a technical correction); Second support: $4260 (a key support level for the current upward trend; holding this level will maintain the bullish trend). The focus going forward will be on three key variables that will directly influence gold's price movements: today's US PPI inflation data, the real-time strength of the US dollar index, and the policy decision and tone of the Federal Reserve's interest rate meeting on September 15-16.
- Risk Warning and Disclaimer
- The market involves risk, and trading may not be suitable for all investors. This article is for reference only and does not constitute personal investment advice, nor does it take into account certain users’ specific investment objectives, financial situation, or other needs. Any investment decisions made based on this information are at your own risk.