The PPI unexpectedly cooled in July, and a price signal masked by the overall index is emerging.
2026-08-13 21:30:55
On Thursday, August 13th, following the release of the US July Producer Price Index (PPI) data, the US dollar index experienced increased short-term volatility, briefly touching 99.79 before currently trading around 99.83. The latest data showed that the final demand PPI remained flat month-on-month in July, but rose 4.7% year-on-year, significantly lower than June's 5.5%. During the same period, energy prices fell 3.1% month-on-month, and food prices fell 0.9%, collectively reducing pressure on commodity prices. Market focus has shifted from simply the level of inflation to the internal structure of price pressures and how these components will affect the Federal Reserve's policy decisions in September. The July PPI was 0% month-on-month and 4.7% year-on-year, seemingly a significant cooling, but a closer look reveals that not all price pressures disappeared simultaneously. Final demand commodity prices fell 0.7% month-on-month, with energy falling 3.1% and food falling 0.9%; conversely, final demand service prices still rose 0.2%. This means that a significant portion of the July PPI improvement came from declines in commodity and energy prices, while service prices remained relatively stable. More noteworthy is that, excluding food, energy, and trade services, final demand prices rose 0.4% month-on-month, but still reached 4.7% year-on-year. Therefore, the overall decline in PPI cannot be simply equated with the complete relief of underlying inflationary pressures.  The service sector also exhibits significant internal differentiation. Portfolio management service prices rose 6.5% in a single month, while transportation and warehousing service prices fell 1.8%, and trucking prices also declined by 1.8%. This structure indicates that the impact of earlier energy and logistics costs is weakening, but some financial and service costs remain relatively high. The most direct driver of this round of PPI changes comes from energy. In July, final demand energy prices fell by 3.1%, and gasoline prices fell by 5.7%; processed energy products in intermediate demand also fell by 3.1%, and unprocessed energy materials fell by 7.4%, with crude oil prices falling by 11.9%. From the production chain perspective, the pressure of upstream energy shocks spreading to manufacturing, transportation, and end products has significantly weakened compared to previous stages. However, the data cannot be viewed solely from an energy perspective. In July, intermediate demand prices for services still rose by 0.5%, a year-on-year increase of 5.1%; fourth-stage intermediate demand prices rose by 0.6%, a year-on-year increase of 6.7%. This indicates that the cost structure of enterprises is gradually shifting from a clear energy driver to service fees, wage-related costs, and pricing pressures in some industries. Prices of electronic components and accessories rose by nearly 28% year-on-year, and prices of computers and related equipment rose by 9.8% year-on-year. This type of data is noteworthy because the rapid growth in investment in data centers and computing infrastructure may create cost sources in some hardware supply chains that differ from traditional energy cycles. This reflects not general commodity inflation, but rather a significant structural price change within capital-intensive industries. The US dollar index briefly rose above 100 before the data release, then fell back to around 99.8. On the 10-minute chart, the price is below the Bollinger Middle Band at 99.8929 and close to the lower band; the MACD DIFF is -0.0237, DEA is -0.0190, and the histogram is negative.
 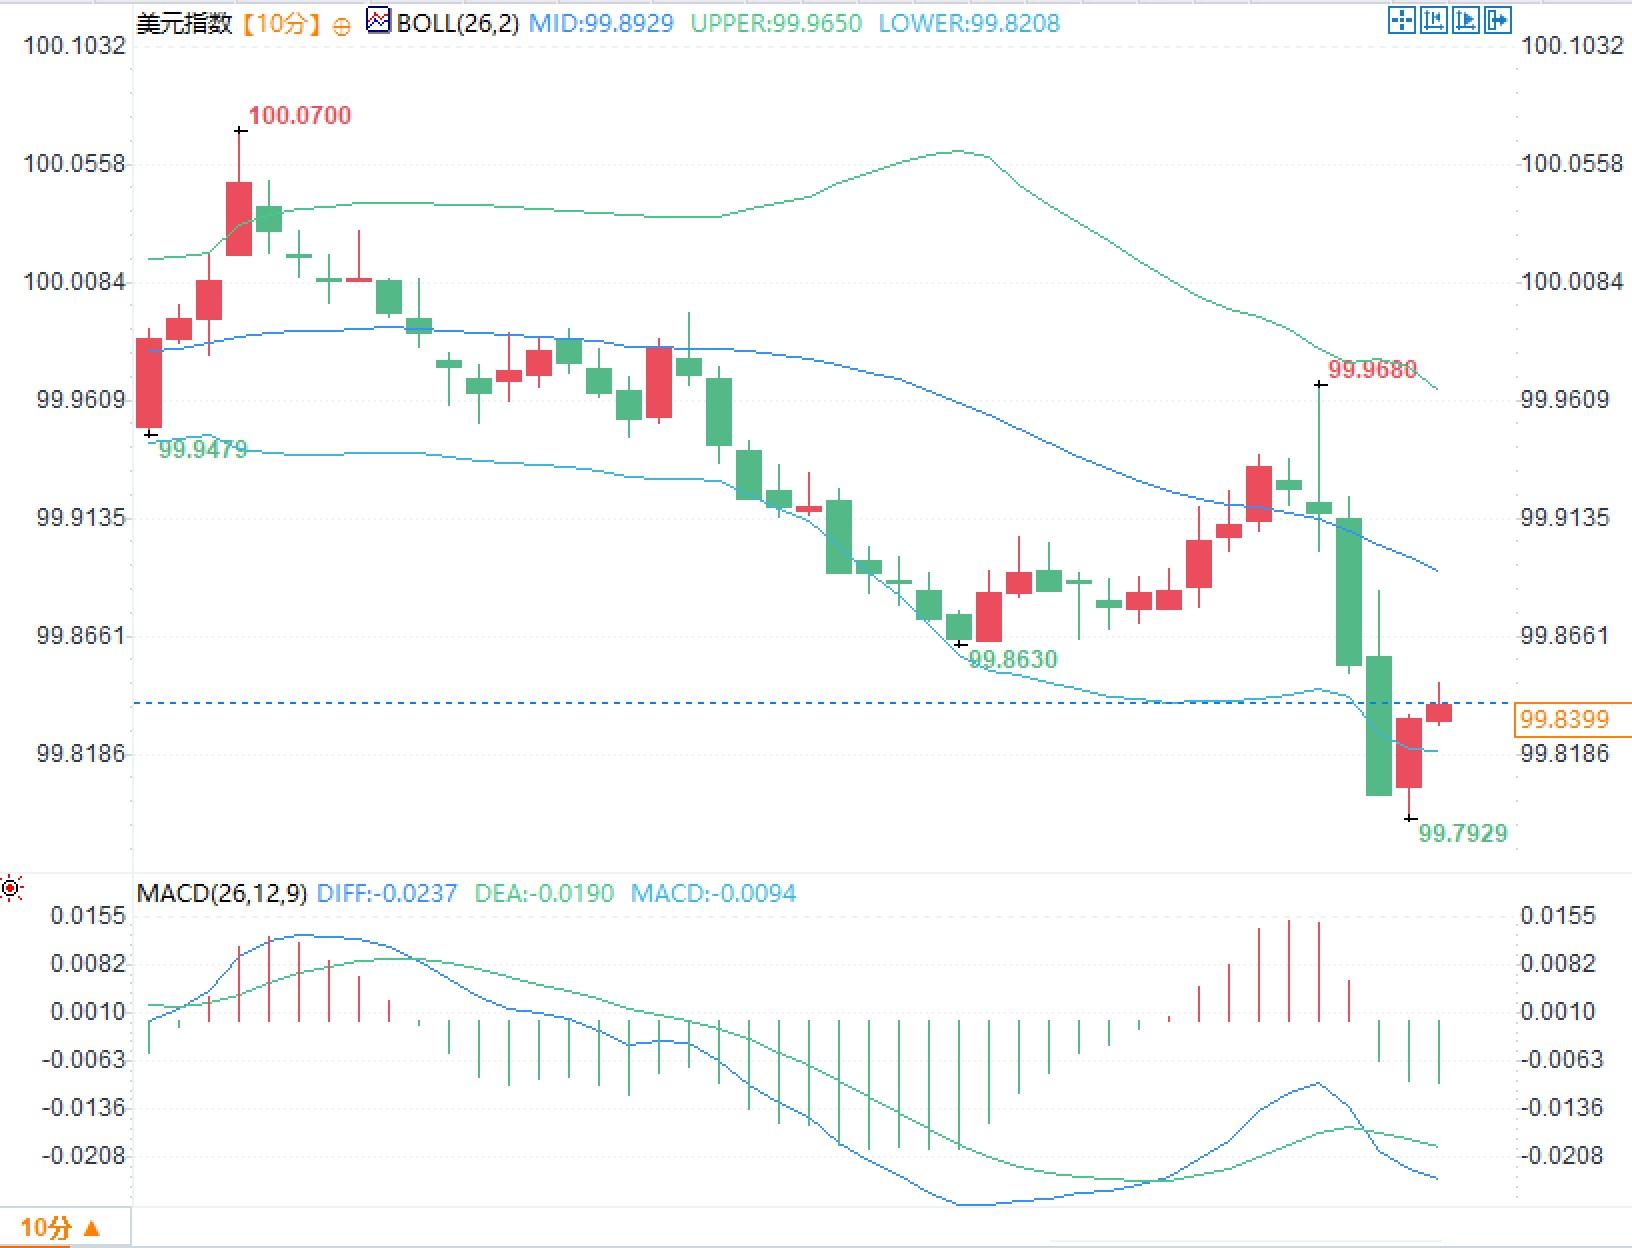 More importantly, there's the fundamental pricing logic. July's PPI was lower than widely expected, while unemployment claims saw a slight increase. Initial jobless claims for the week ending August 8th rose by 9,000 to 209,000, while the four-week moving average remained at 199,000; the previous week's continuing claims were approximately 1.777 million. While a single week's claims figures are insufficient to confirm a change in employment trends, given the recent slowdown in hiring momentum, both inflation and employment are simultaneously entering the Fed's policy balance. Therefore, the dollar is not currently facing a single "declining inflation" logic, but rather the simultaneous influence of three variables: a weakening energy shock reducing short-term inflationary pressures, sticky service prices limiting a further rapid decline in inflation, and a marginal slowdown in employment increasing the necessity for policy stability. The market is truly trading on the relative changes between these three, not just a PPI figure itself. The next important inflation confirmation will come from July's personal consumption expenditure price data, to be released on August 26th, along with personal income and consumption data. Based on the PPI breakdown, several institutions estimate that the core personal consumption expenditure price index in July may be around 0.2% month-on-month, but the final result still needs to be confirmed by official data.
The service sector also exhibits significant internal differentiation. Portfolio management service prices rose 6.5% in a single month, while transportation and warehousing service prices fell 1.8%, and trucking prices also declined by 1.8%. This structure indicates that the impact of earlier energy and logistics costs is weakening, but some financial and service costs remain relatively high. The most direct driver of this round of PPI changes comes from energy. In July, final demand energy prices fell by 3.1%, and gasoline prices fell by 5.7%; processed energy products in intermediate demand also fell by 3.1%, and unprocessed energy materials fell by 7.4%, with crude oil prices falling by 11.9%. From the production chain perspective, the pressure of upstream energy shocks spreading to manufacturing, transportation, and end products has significantly weakened compared to previous stages. However, the data cannot be viewed solely from an energy perspective. In July, intermediate demand prices for services still rose by 0.5%, a year-on-year increase of 5.1%; fourth-stage intermediate demand prices rose by 0.6%, a year-on-year increase of 6.7%. This indicates that the cost structure of enterprises is gradually shifting from a clear energy driver to service fees, wage-related costs, and pricing pressures in some industries. Prices of electronic components and accessories rose by nearly 28% year-on-year, and prices of computers and related equipment rose by 9.8% year-on-year. This type of data is noteworthy because the rapid growth in investment in data centers and computing infrastructure may create cost sources in some hardware supply chains that differ from traditional energy cycles. This reflects not general commodity inflation, but rather a significant structural price change within capital-intensive industries. The US dollar index briefly rose above 100 before the data release, then fell back to around 99.8. On the 10-minute chart, the price is below the Bollinger Middle Band at 99.8929 and close to the lower band; the MACD DIFF is -0.0237, DEA is -0.0190, and the histogram is negative. More importantly, there's the fundamental pricing logic. July's PPI was lower than widely expected, while unemployment claims saw a slight increase. Initial jobless claims for the week ending August 8th rose by 9,000 to 209,000, while the four-week moving average remained at 199,000; the previous week's continuing claims were approximately 1.777 million. While a single week's claims figures are insufficient to confirm a change in employment trends, given the recent slowdown in hiring momentum, both inflation and employment are simultaneously entering the Fed's policy balance. Therefore, the dollar is not currently facing a single "declining inflation" logic, but rather the simultaneous influence of three variables: a weakening energy shock reducing short-term inflationary pressures, sticky service prices limiting a further rapid decline in inflation, and a marginal slowdown in employment increasing the necessity for policy stability. The market is truly trading on the relative changes between these three, not just a PPI figure itself. The next important inflation confirmation will come from July's personal consumption expenditure price data, to be released on August 26th, along with personal income and consumption data. Based on the PPI breakdown, several institutions estimate that the core personal consumption expenditure price index in July may be around 0.2% month-on-month, but the final result still needs to be confirmed by official data.
- Risk Warning and Disclaimer
- The market involves risk, and trading may not be suitable for all investors. This article is for reference only and does not constitute personal investment advice, nor does it take into account certain users’ specific investment objectives, financial situation, or other needs. Any investment decisions made based on this information are at your own risk.