USD/JPY: Ignoring weak US economic data, comments from the Bank of Japan about accelerating interest rate hikes gain traction.
2026-08-14 18:14:55
Over the past week, much market discussion has revolved around weaker-than-expected US non-farm payrolls, cooling US CPI inflation data, and lower-than-expected overnight PPI producer price index. Influenced by this data, the market has lowered its pricing expectations for Federal Reserve rate hikes over the next year.  Meanwhile, the market increasingly speculated that the Bank of Japan might raise interest rates sooner than previously expected. Logically, this news should have provided positive support for the yen. However, the market did not react as expected. This means that simply relying on the Bank of Japan accelerating its rate hikes or weakening US economic data may not be enough to fundamentally reverse the upward trend of the USD/JPY. Slowing US Economic Growth For a long time, the "unique resilience of the US economy" has been considered one of the driving factors behind the USD/JPY's continuous rise to multi-decade highs. However, recent data is shaking this logic: the Citi Economic Surprise Index shows that while US data remains positive, it has fallen to its lowest level since early May. In contrast, Japan's economic data, while not as surprising as it was a month ago, is still generally positive, particularly compared to historical benchmarks. Even the potential threat of official intervention for the yen has not reversed the exchange rate trend; the significant cooling of expectations for a Fed rate hike has also not brought significant downward pressure to the USD/JPY. Markets Lower Expectations for Fed Rate Hike Path Over the past few weeks, market pricing in rate hikes by the Federal Reserve at its June meeting has fallen sharply. By the end of July, the market had priced in a cumulative rate hike of over 64 basis points, but after a series of weak key economic data releases in the past week—non-farm payrolls, CPI, and PPI—current rate hike expectations have dropped to only 36 basis points. Bank of Japan Needs to Take a Hawkish Stance Beyond Market Expectations Thursday's macro news was generally quiet, but a Bloomberg report drew widespread attention: it stated that the Japanese government's acceptance of the Bank of Japan starting a rate hike earlier is increasing. Sources indicated that the Japanese government supports an earlier rate hike, with September or October being the most likely window. The report also mentioned that the Japanese government and the central bank are increasingly aligned on dealing with the yen's depreciation; an earlier rate hike could solidify the effects of the joint US-Japan intervention in the exchange rate at the end of July. However, this assessment clearly deviates from real market logic: even if the rate hike is brought forward, if the total magnitude of the rate hike priced in by the market does not change substantially, the timing is of limited significance. As shown in the chart below, the market has already priced in a high probability of a September rate hike (approximately 74%), a full rate hike in October, and a total of more than three rate hikes by the middle of next year. This scenario is by no means a certainty. However, if the Bank of Japan wants to boost market confidence in the yen and alleviate pressure on long-term Japanese government bond yields—after excluding government subsidies, Japanese inflation has consistently exceeded the policy target, a persistent problem for the bond market—the central bank must demonstrate a more hawkish stance than the market expects. In other words, the central bank not only needs to signal an accelerated pace of rate hikes, but the overall tightening力度 must also exceed current market pricing. Simply bringing forward the timing of the next rate hike is unlikely to achieve the policy objectives. The drivers of exchange rates are shifting. The signals from the correlation matrix are worth noting. Although the statistical period is short and the conclusions should be interpreted cautiously, over the past week, the USD/JPY pair showed a very strong positive correlation with both short- and long-term US Treasury yields; while the correlation of the USD/JPY interest rate differential was relatively weak, and its correlation with Fed rate hike expectations remained at a moderate level. Furthermore, the currency pair also showed a high correlation with energy prices (especially Brent crude oil). This reflects the geopolitical situation and the fact that Japan is more vulnerable to energy price increases than the US, which also affects exchange rates. However, the correlation matrix is only based on the statistical direction of closing prices. Observing the actual market reaction to changes in yields and interest rate differentials reveals that the USD/JPY exchange rate is far more sensitive to rising yields than to falling yields. A rise in US Treasury yields and a widening interest rate differential of the same magnitude leads to a stronger upward reaction in the exchange rate than a fall in yields. Within the same short period, the USD/JPY exchange rate and US stock futures are negatively correlated, indicating that overall risk appetite does not have a significant impact on this currency pair. The strong correlation between US dollar yields and the USD/JPY interest rate differential suggests that, at least for now, the outlook for Japanese domestic interest rates is not the core driver of the exchange rate. Therefore, news like the one that broke on Thursday, unless it can substantially change market expectations regarding the extent of the Bank of Japan's tightening, will have a relatively limited actual impact. The exchange rate trend is repeating the pattern after intervention. Observing the USD/JPY daily chart, the current trend is strikingly similar to the pattern after the last round of exchange rate intervention in April and May: the exchange rate fluctuated briefly before rising again, and even with the US participating in this round of joint intervention, this pattern has not been changed. Furthermore, the currency pair continues to hold the upward trend line that began last April, rebounding from this trend line twice in the last three trading days. This trend line has held support multiple times since its formation, even during the currency intervention phase in April and May, making it a key downside support level to watch. The 158.58 level has acted as both support and resistance over the past two weeks, forming the lower edge of the current support range.
 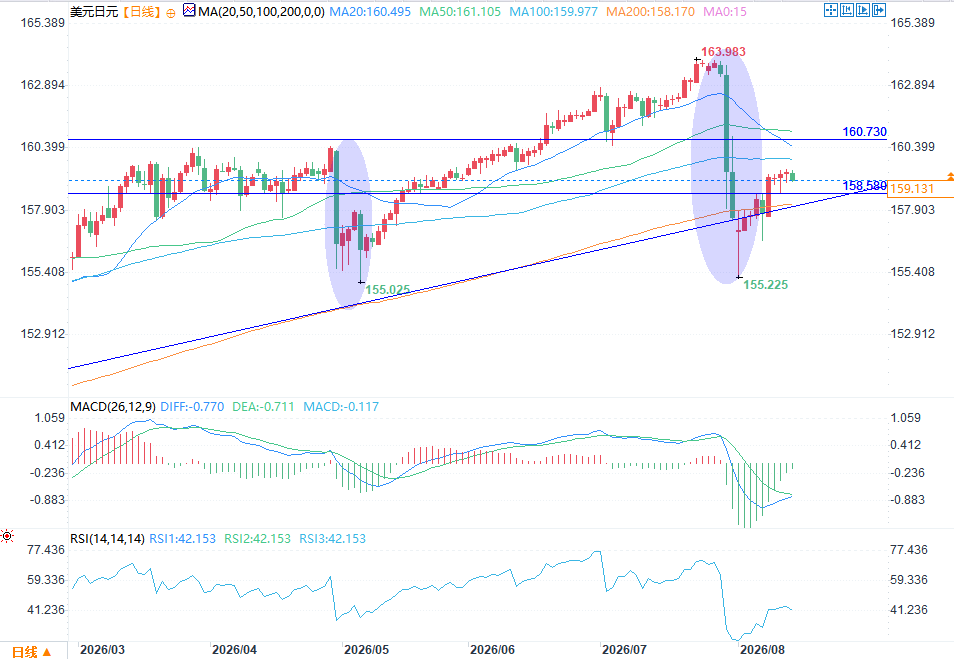 (USD/JPY Daily Chart Source: EasyForex) Looking upwards, as previously analyzed, the 100-day simple moving average is the primary target for bulls; further up, the multi-decade high of 160.73 reached this year is the next key resistance level. After breaking below 158.58, the 200-day moving average and the August 7th low of 156.68 will become important downside levels; a further break below these levels carries the risk of a retest of the previous low point after currency intervention. Considering the current resilience of the exchange rate, the short-term bias is towards buying on dips, targeting the 100-day simple moving average. Due to data disturbances caused by currency intervention, the reference value of technical oscillators has decreased, but the indicators themselves are strengthening: the 14-period Relative Strength Index (RSI) has rebounded and is approaching the neutral 50 level; the MACD indicator is also about to cross the signal line upwards, forming a golden cross. At least it can be seen that the short-term downward momentum brought about by intervention is rapidly fading. While the overall technical picture isn't exactly bullish and leans more towards neutral, buying on dips is a better option than chasing highs and shorting.
Meanwhile, the market increasingly speculated that the Bank of Japan might raise interest rates sooner than previously expected. Logically, this news should have provided positive support for the yen. However, the market did not react as expected. This means that simply relying on the Bank of Japan accelerating its rate hikes or weakening US economic data may not be enough to fundamentally reverse the upward trend of the USD/JPY. Slowing US Economic Growth For a long time, the "unique resilience of the US economy" has been considered one of the driving factors behind the USD/JPY's continuous rise to multi-decade highs. However, recent data is shaking this logic: the Citi Economic Surprise Index shows that while US data remains positive, it has fallen to its lowest level since early May. In contrast, Japan's economic data, while not as surprising as it was a month ago, is still generally positive, particularly compared to historical benchmarks. Even the potential threat of official intervention for the yen has not reversed the exchange rate trend; the significant cooling of expectations for a Fed rate hike has also not brought significant downward pressure to the USD/JPY. Markets Lower Expectations for Fed Rate Hike Path Over the past few weeks, market pricing in rate hikes by the Federal Reserve at its June meeting has fallen sharply. By the end of July, the market had priced in a cumulative rate hike of over 64 basis points, but after a series of weak key economic data releases in the past week—non-farm payrolls, CPI, and PPI—current rate hike expectations have dropped to only 36 basis points. Bank of Japan Needs to Take a Hawkish Stance Beyond Market Expectations Thursday's macro news was generally quiet, but a Bloomberg report drew widespread attention: it stated that the Japanese government's acceptance of the Bank of Japan starting a rate hike earlier is increasing. Sources indicated that the Japanese government supports an earlier rate hike, with September or October being the most likely window. The report also mentioned that the Japanese government and the central bank are increasingly aligned on dealing with the yen's depreciation; an earlier rate hike could solidify the effects of the joint US-Japan intervention in the exchange rate at the end of July. However, this assessment clearly deviates from real market logic: even if the rate hike is brought forward, if the total magnitude of the rate hike priced in by the market does not change substantially, the timing is of limited significance. As shown in the chart below, the market has already priced in a high probability of a September rate hike (approximately 74%), a full rate hike in October, and a total of more than three rate hikes by the middle of next year. This scenario is by no means a certainty. However, if the Bank of Japan wants to boost market confidence in the yen and alleviate pressure on long-term Japanese government bond yields—after excluding government subsidies, Japanese inflation has consistently exceeded the policy target, a persistent problem for the bond market—the central bank must demonstrate a more hawkish stance than the market expects. In other words, the central bank not only needs to signal an accelerated pace of rate hikes, but the overall tightening力度 must also exceed current market pricing. Simply bringing forward the timing of the next rate hike is unlikely to achieve the policy objectives. The drivers of exchange rates are shifting. The signals from the correlation matrix are worth noting. Although the statistical period is short and the conclusions should be interpreted cautiously, over the past week, the USD/JPY pair showed a very strong positive correlation with both short- and long-term US Treasury yields; while the correlation of the USD/JPY interest rate differential was relatively weak, and its correlation with Fed rate hike expectations remained at a moderate level. Furthermore, the currency pair also showed a high correlation with energy prices (especially Brent crude oil). This reflects the geopolitical situation and the fact that Japan is more vulnerable to energy price increases than the US, which also affects exchange rates. However, the correlation matrix is only based on the statistical direction of closing prices. Observing the actual market reaction to changes in yields and interest rate differentials reveals that the USD/JPY exchange rate is far more sensitive to rising yields than to falling yields. A rise in US Treasury yields and a widening interest rate differential of the same magnitude leads to a stronger upward reaction in the exchange rate than a fall in yields. Within the same short period, the USD/JPY exchange rate and US stock futures are negatively correlated, indicating that overall risk appetite does not have a significant impact on this currency pair. The strong correlation between US dollar yields and the USD/JPY interest rate differential suggests that, at least for now, the outlook for Japanese domestic interest rates is not the core driver of the exchange rate. Therefore, news like the one that broke on Thursday, unless it can substantially change market expectations regarding the extent of the Bank of Japan's tightening, will have a relatively limited actual impact. The exchange rate trend is repeating the pattern after intervention. Observing the USD/JPY daily chart, the current trend is strikingly similar to the pattern after the last round of exchange rate intervention in April and May: the exchange rate fluctuated briefly before rising again, and even with the US participating in this round of joint intervention, this pattern has not been changed. Furthermore, the currency pair continues to hold the upward trend line that began last April, rebounding from this trend line twice in the last three trading days. This trend line has held support multiple times since its formation, even during the currency intervention phase in April and May, making it a key downside support level to watch. The 158.58 level has acted as both support and resistance over the past two weeks, forming the lower edge of the current support range. (USD/JPY Daily Chart Source: EasyForex) Looking upwards, as previously analyzed, the 100-day simple moving average is the primary target for bulls; further up, the multi-decade high of 160.73 reached this year is the next key resistance level. After breaking below 158.58, the 200-day moving average and the August 7th low of 156.68 will become important downside levels; a further break below these levels carries the risk of a retest of the previous low point after currency intervention. Considering the current resilience of the exchange rate, the short-term bias is towards buying on dips, targeting the 100-day simple moving average. Due to data disturbances caused by currency intervention, the reference value of technical oscillators has decreased, but the indicators themselves are strengthening: the 14-period Relative Strength Index (RSI) has rebounded and is approaching the neutral 50 level; the MACD indicator is also about to cross the signal line upwards, forming a golden cross. At least it can be seen that the short-term downward momentum brought about by intervention is rapidly fading. While the overall technical picture isn't exactly bullish and leans more towards neutral, buying on dips is a better option than chasing highs and shorting.
- Risk Warning and Disclaimer
- The market involves risk, and trading may not be suitable for all investors. This article is for reference only and does not constitute personal investment advice, nor does it take into account certain users’ specific investment objectives, financial situation, or other needs. Any investment decisions made based on this information are at your own risk.