Gold prices cooled after hitting a two-month high, and the real forces suppressing prices have emerged.
2026-08-14 20:30:55
On Friday, August 14th, spot gold entered a period of high-level consolidation after hitting a two-month high in the previous trading day, currently trading around $4370 per ounce, converging from Thursday's high; the US dollar index was around 99.6 during the same period, still trading below the 100 mark. The core contradiction in the market has now shifted from simply geopolitical risk premiums to a repricing of the relationship between cooling inflation, weakening employment, high energy prices, and firm long-term interest rates. The most crucial variable this week comes from inflation data. The US Consumer Price Index (CPI) rose only 0.1% month-on-month in July, with the year-on-year increase slowing to 3.4% from 3.5% in June; the core CPI, excluding food and energy, rose 0.2% month-on-month and 2.5% year-on-year. This means that the reflation concerns previously triggered by the energy shock have not yet fully transmitted to core prices. Production-side data further reinforces this judgment. The US final demand producer price index was flat month-on-month in July, compared to a 0.1% decline in June. Among them, goods prices fell 0.7%, energy prices fell 3.1%, and service prices rose 0.2%. However, it is worth noting that the producer price index, excluding food, energy, and trade services, still rose 0.4% month-on-month and 4.7% year-on-year. Therefore, the more accurate meaning of this round of data is not that inflationary pressures have disappeared, but rather that the urgency for a short-term interest rate hike has decreased.  This change directly impacts interest rate futures. CME FedWatch shows the probability of a Fed rate hike in September has fallen to about 31%, meaning the market is pricing in nearly 70% of the rate remaining unchanged. Gold has thus received significant support, as non-interest-bearing assets are most sensitive not to absolute interest rates, but to whether the marginal interest rate path will continue to rise. The reason why cooling inflation has a more pronounced impact on gold is that the labor market has not created additional pressure on the Fed. US non-farm payrolls fell by 23,000 in July, with the unemployment rate at 4.1%. The job decline was mainly concentrated in local government education and retail sectors, while healthcare continued to grow. This data changes the risk ranking in the policy function. When inflation is well above target and employment remains strong, the Fed is more likely to tolerate further tightening of financial conditions; however, when job expansion slows significantly and core consumer inflation continues to decline, further rate hikes require stronger data evidence. Recently, there has also been significant internal disagreement within the Fed. Some officials believe that current policy is sufficiently restrictive and that they can wait for the energy shock and the subsequent transmission of previous price increases; others are concerned that inflation expectations remain high and it is not advisable to prematurely declare the policy mission complete. The current market is not trading on a confirmed easing cycle, but rather on the delayed interest rate hike timetable and extended policy observation period. The recent rise in gold prices does not signify a one-way driving force in the macroeconomic environment. A crucial structural characteristic is the easing of short-term policy expectations, while long-term financing costs remain high. On August 14th, the yield on the 2-year US Treasury note was around 4.14%, while the 10-year yield remained above 4.6%. Previously, the yield on the 30-year Treasury note reached 5.216%, reflecting persistently high long-term inflation risks, fiscal financing needs, and term premiums. This has two effects on gold. First, the decline in short-term yields reduces the opportunity cost of holding gold, a key reason for the recent rapid price increase. Second, if long-term real yields remain high, the discount rate in the financial system has not decreased accordingly, thus constraining gold valuation expansion. Energy prices further exacerbate this contradiction. Brent crude is trading around $88 per barrel, with a cumulative increase of nearly 6% this week, and uncertainties related to the Strait of Hormuz have caused energy risk premiums to rise again. High energy prices can support gold through safe-haven demand, but they may also reignite inflation expectations and boost long-term yields. Therefore, energy shocks are not a simple one-way variable for gold, but rather affect both safe-haven premiums and real interest rates simultaneously. Looking at the daily chart, gold previously recovered rapidly from a low near 3959, briefly touching around 4449, before pulling back after forming a two-month high. The Bollinger Band middle line is around 4143, and the upper line is around 4426. The price had previously deviated significantly from the middle line and tested the upper line area, after which the volatility began to converge.
 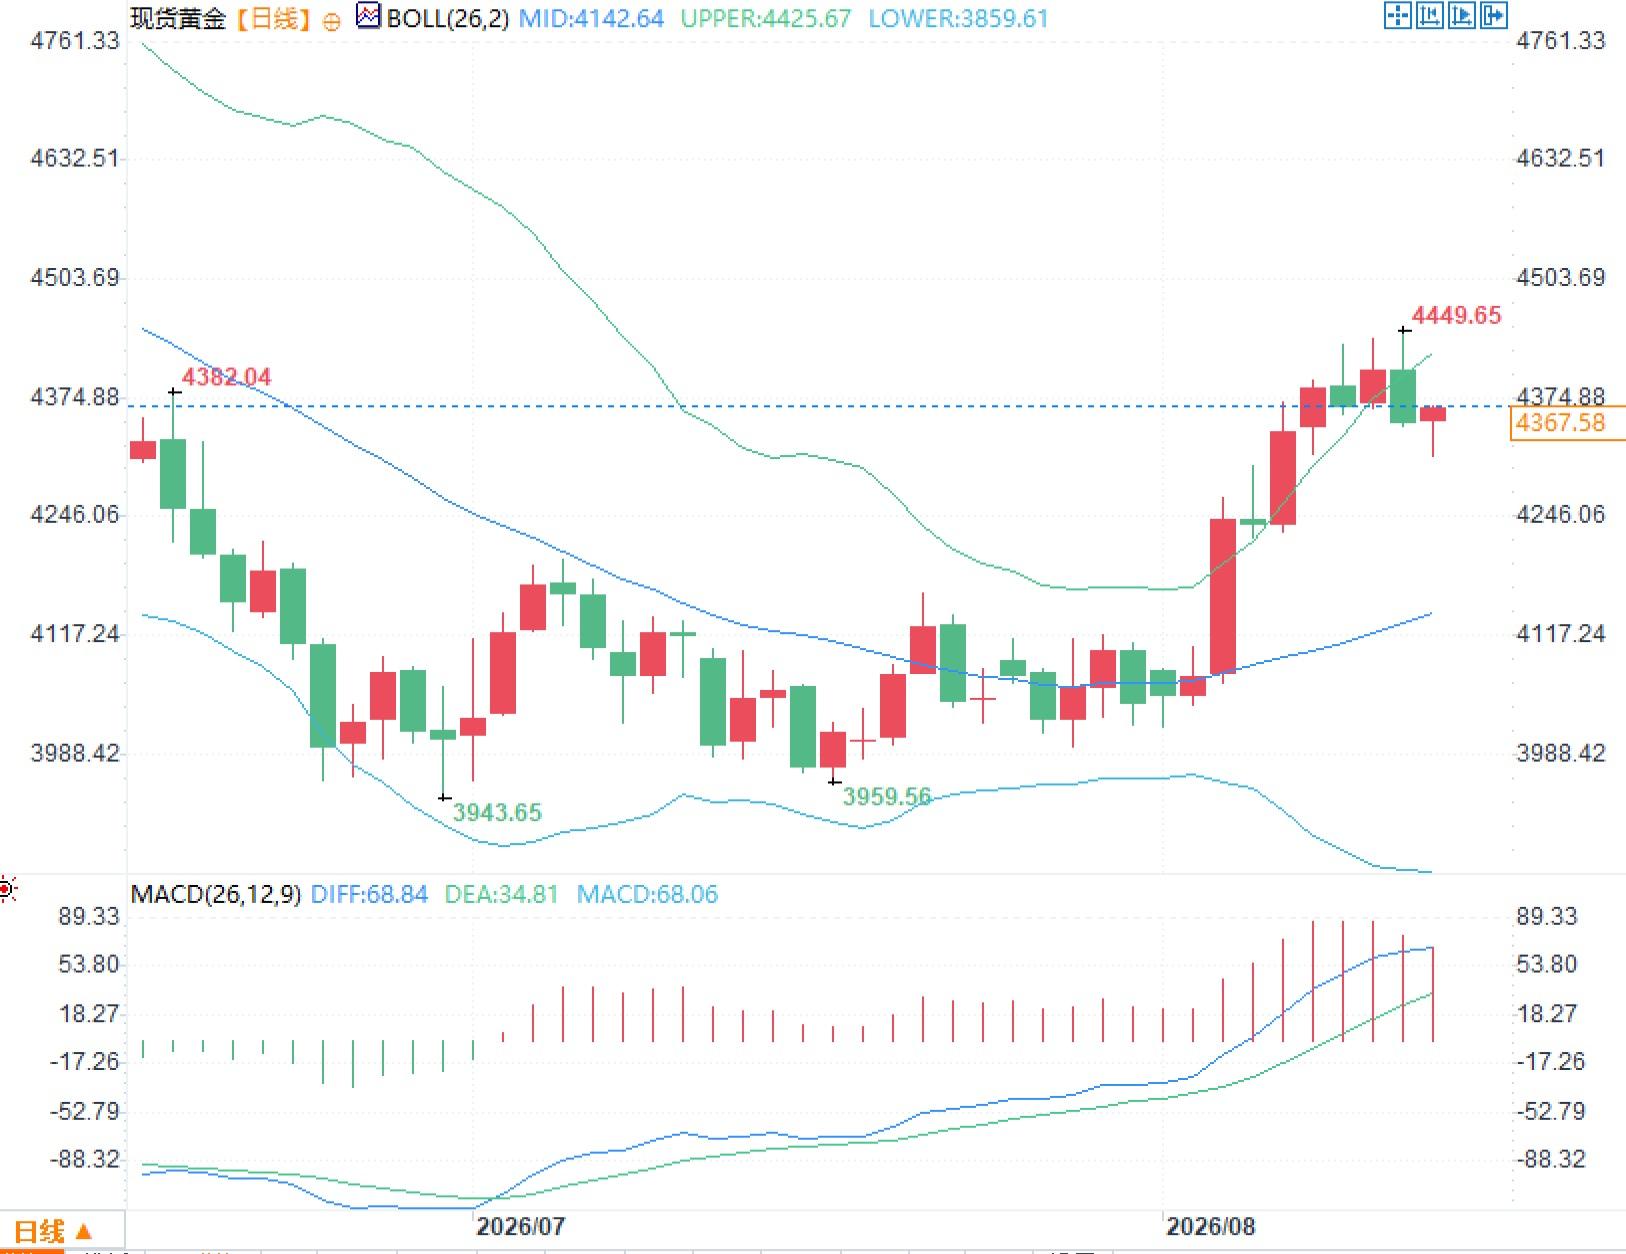 Regarding the MACD, the DIFF is around 68.84 and the DEA is around 34.81, both continuing to operate above the zero line, indicating that the previously formed medium-term repair structure has not been broken. At the same time, the rate of expansion of the histogram after the rapid rise has begun to slow, reflecting a rebalancing between short-term momentum and price increases. More noteworthy is the Bollinger Band pattern. The middle band has gradually shifted from a downward trend to an upward trend, while the upper band has opened simultaneously, and the price has retreated from near the upper band. This structure typically signifies that the market has broken out of the previous low-volatility consolidation range and entered a new high-volatility state.
This change directly impacts interest rate futures. CME FedWatch shows the probability of a Fed rate hike in September has fallen to about 31%, meaning the market is pricing in nearly 70% of the rate remaining unchanged. Gold has thus received significant support, as non-interest-bearing assets are most sensitive not to absolute interest rates, but to whether the marginal interest rate path will continue to rise. The reason why cooling inflation has a more pronounced impact on gold is that the labor market has not created additional pressure on the Fed. US non-farm payrolls fell by 23,000 in July, with the unemployment rate at 4.1%. The job decline was mainly concentrated in local government education and retail sectors, while healthcare continued to grow. This data changes the risk ranking in the policy function. When inflation is well above target and employment remains strong, the Fed is more likely to tolerate further tightening of financial conditions; however, when job expansion slows significantly and core consumer inflation continues to decline, further rate hikes require stronger data evidence. Recently, there has also been significant internal disagreement within the Fed. Some officials believe that current policy is sufficiently restrictive and that they can wait for the energy shock and the subsequent transmission of previous price increases; others are concerned that inflation expectations remain high and it is not advisable to prematurely declare the policy mission complete. The current market is not trading on a confirmed easing cycle, but rather on the delayed interest rate hike timetable and extended policy observation period. The recent rise in gold prices does not signify a one-way driving force in the macroeconomic environment. A crucial structural characteristic is the easing of short-term policy expectations, while long-term financing costs remain high. On August 14th, the yield on the 2-year US Treasury note was around 4.14%, while the 10-year yield remained above 4.6%. Previously, the yield on the 30-year Treasury note reached 5.216%, reflecting persistently high long-term inflation risks, fiscal financing needs, and term premiums. This has two effects on gold. First, the decline in short-term yields reduces the opportunity cost of holding gold, a key reason for the recent rapid price increase. Second, if long-term real yields remain high, the discount rate in the financial system has not decreased accordingly, thus constraining gold valuation expansion. Energy prices further exacerbate this contradiction. Brent crude is trading around $88 per barrel, with a cumulative increase of nearly 6% this week, and uncertainties related to the Strait of Hormuz have caused energy risk premiums to rise again. High energy prices can support gold through safe-haven demand, but they may also reignite inflation expectations and boost long-term yields. Therefore, energy shocks are not a simple one-way variable for gold, but rather affect both safe-haven premiums and real interest rates simultaneously. Looking at the daily chart, gold previously recovered rapidly from a low near 3959, briefly touching around 4449, before pulling back after forming a two-month high. The Bollinger Band middle line is around 4143, and the upper line is around 4426. The price had previously deviated significantly from the middle line and tested the upper line area, after which the volatility began to converge. Regarding the MACD, the DIFF is around 68.84 and the DEA is around 34.81, both continuing to operate above the zero line, indicating that the previously formed medium-term repair structure has not been broken. At the same time, the rate of expansion of the histogram after the rapid rise has begun to slow, reflecting a rebalancing between short-term momentum and price increases. More noteworthy is the Bollinger Band pattern. The middle band has gradually shifted from a downward trend to an upward trend, while the upper band has opened simultaneously, and the price has retreated from near the upper band. This structure typically signifies that the market has broken out of the previous low-volatility consolidation range and entered a new high-volatility state.
- Risk Warning and Disclaimer
- The market involves risk, and trading may not be suitable for all investors. This article is for reference only and does not constitute personal investment advice, nor does it take into account certain users’ specific investment objectives, financial situation, or other needs. Any investment decisions made based on this information are at your own risk.