Gold has entered a high volatility zone; why has the divergence suddenly widened around $4400?
2026-08-17 20:32:56
On Monday, August 17th, spot gold traded around $4395 per ounce. During the same period, the US dollar index fell by approximately 0.2% to 0.3%, hitting a low of around 99.28, its lowest level since June. The yield on the 10-year US Treasury note fell back to approximately 4.68%, indicating that the three traditional variables for gold pricing—interest rate expectations, the US dollar, and geopolitical risks—were changing simultaneously again. Meanwhile, the situation in the Middle East has once again become a significant source of volatility across asset markets. Escalating conflict in Lebanon and ongoing negotiations regarding navigation arrangements in the Strait of Hormuz have kept international oil prices high. Brent crude oil briefly traded above $89 per barrel, with a cumulative increase of approximately 6% to 7% last week. The repricing of energy prices, inflation expectations, and real interest rates means that gold is currently facing not just a simple safe-haven logic, but a more complex chain of macroeconomic asset pricing.  The recent strength in gold prices stems primarily from marginal changes in financial conditions. Latest employment, retail sales, and inflation data have led the market to lower its expectations for further short-term interest rate hikes by the Federal Reserve, with the probability of a September rate hike dropping from approximately 50% to 30%-31%. The yield on the 2-year US Treasury note has fallen to around 4.16%, and the 10-year yield to around 4.68%. For gold, which does not generate coupon income, the key market focus is not on the absolute level of nominal interest rates, but rather on the repricing of real yields and the future path of interest rates. The simultaneous decline in the US dollar index further amplified this impact. After the dollar index fell to around 99.4, the relative cost of dollar-denominated gold decreased for holders of other currencies. However, the dollar and gold do not always maintain a stable negative correlation. If energy prices remain high and reignite inflation risks, the dollar, Treasury yields, and gold may experience periods of co-movement. Therefore, the market cannot currently rely solely on the dollar to explain gold prices. The market is currently more focused on the minutes of the Fed's July meeting. Their importance lies not only in discussing the next policy adjustment, but also in confirming how policymakers weigh the impact of growth, employment, and energy prices on inflation. For gold, this directly impacts real interest rate expectations and is a major macroeconomic source of recent price volatility. The impact of the current Middle East situation on gold differs significantly from traditional safe-haven events. The core variable has expanded from simple risk sentiment to the energy supply chain. The Strait of Hormuz previously handled about one-fifth of global oil and gas transport, and negotiations regarding shipping routes and navigation rules have yet to reach a stable conclusion. While relevant parties have discussed new shipping arrangements, progress on agreements does not guarantee an immediate return to normal commercial transport. This makes crude oil a crucial intermediate variable for observing gold prices. After a significant rise last week, Brent crude continued to trade around $89 per barrel on Monday. Sustained high oil prices, on the one hand, strengthen inflation expectations, and on the other hand, may weaken economic activity; their effects on gold are not entirely the same. The former may push up long-term yields, increasing the opportunity cost of holding gold; the latter may increase market attention to a shift in monetary policy and the defensive nature of assets. Therefore, what the gold market should truly focus on now is not a single geopolitical headline, but whether the conflict continues to affect energy transport and how changes in oil prices ultimately feed back into inflation and Federal Reserve policy expectations. From a daily chart perspective, spot gold is currently priced at approximately $4395, with a recent high of $4449.65. The Bollinger Bands show the middle band at approximately $4153.75, the upper band at approximately $4454.90, and the lower band at approximately $3852.61. The price has clearly moved away from the middle band and is approaching the upper band, while the upper Bollinger Band has also risen again, reflecting a significant increase in recent volatility.
 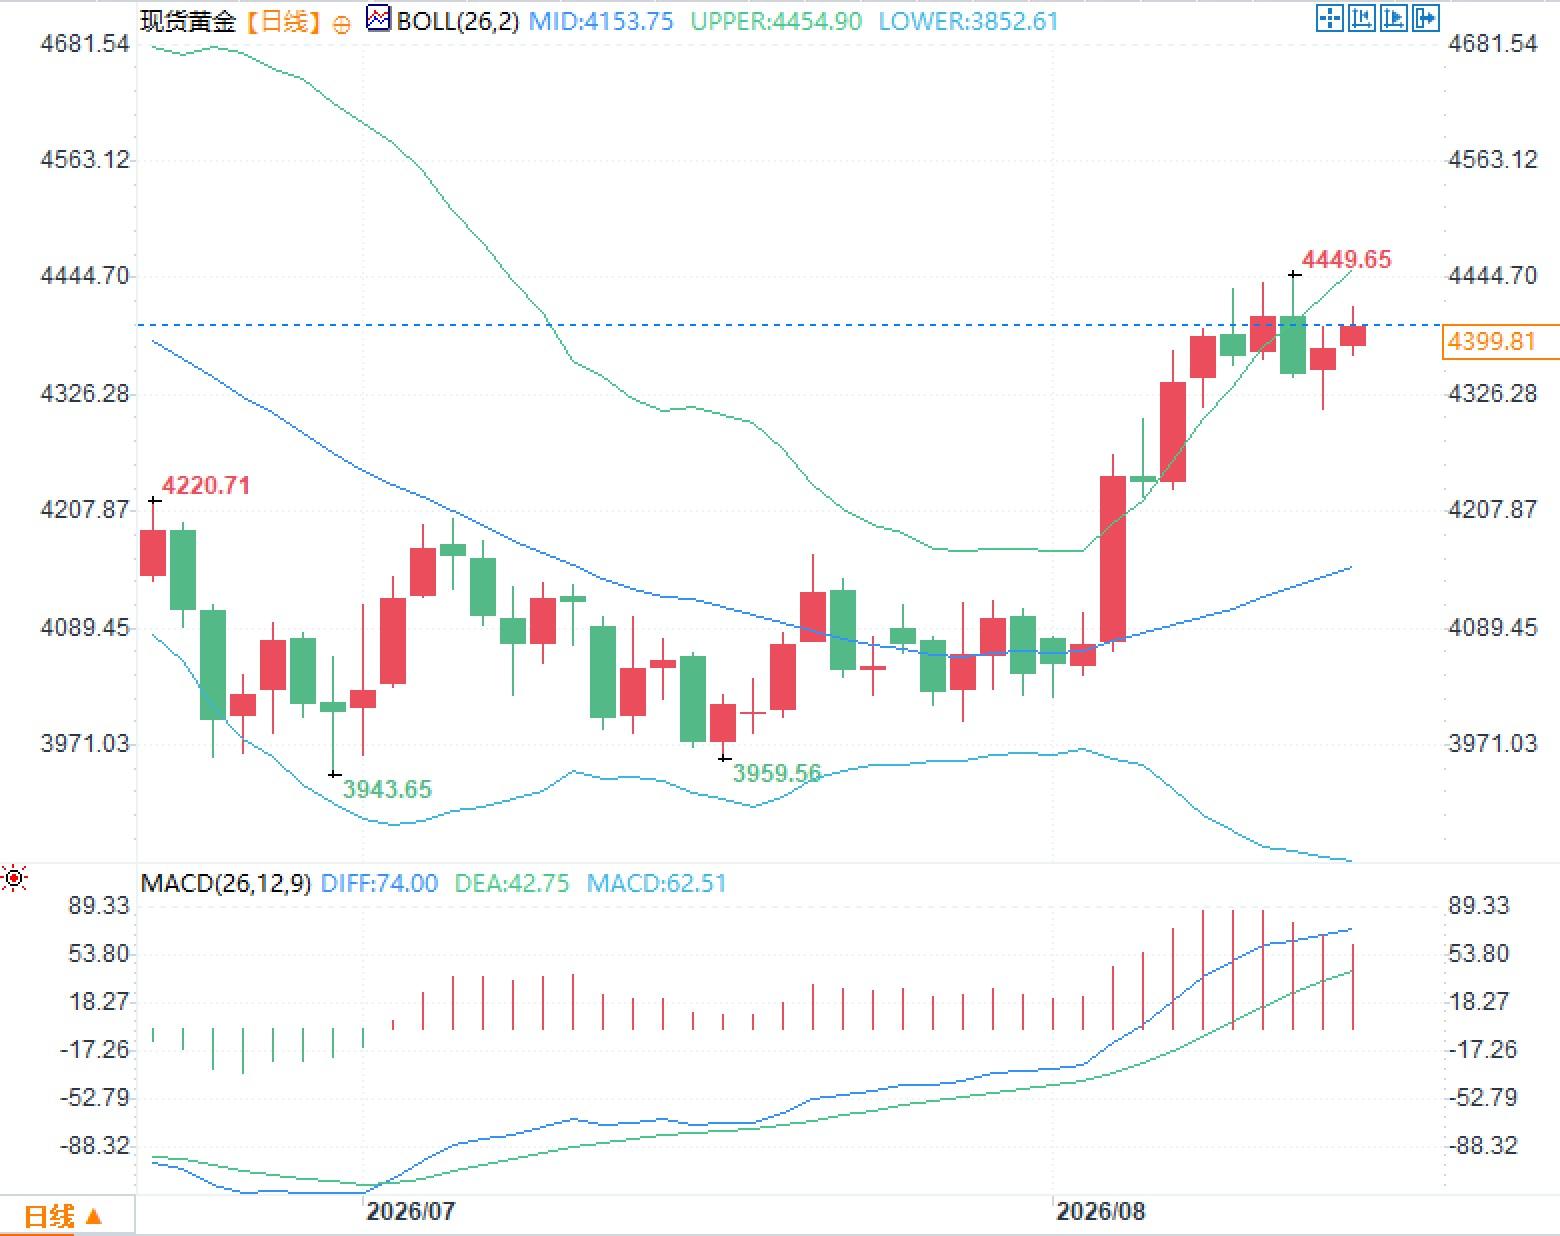 This structure firstly indicates that the market has shifted from a consolidation phase around $4,000 to a more volatile state, rather than simply suggesting that prices are in a definite direction. After prices deviate continuously from the middle band, short-term fluctuations typically become significantly more sensitive to news and interest rate changes. Regarding the MACD, the DIFF is around 74.00, the DEA is around 42.75, and the histogram is around 62.51; both lines are above the zero line, indicating that the previously formed upward momentum has not completely disappeared. However, observing recent candlestick patterns, the price body shortened significantly after reaching around $4,400, and the upper and lower shadows increased, suggesting that divergence in high-level trading is widening.
The recent strength in gold prices stems primarily from marginal changes in financial conditions. Latest employment, retail sales, and inflation data have led the market to lower its expectations for further short-term interest rate hikes by the Federal Reserve, with the probability of a September rate hike dropping from approximately 50% to 30%-31%. The yield on the 2-year US Treasury note has fallen to around 4.16%, and the 10-year yield to around 4.68%. For gold, which does not generate coupon income, the key market focus is not on the absolute level of nominal interest rates, but rather on the repricing of real yields and the future path of interest rates. The simultaneous decline in the US dollar index further amplified this impact. After the dollar index fell to around 99.4, the relative cost of dollar-denominated gold decreased for holders of other currencies. However, the dollar and gold do not always maintain a stable negative correlation. If energy prices remain high and reignite inflation risks, the dollar, Treasury yields, and gold may experience periods of co-movement. Therefore, the market cannot currently rely solely on the dollar to explain gold prices. The market is currently more focused on the minutes of the Fed's July meeting. Their importance lies not only in discussing the next policy adjustment, but also in confirming how policymakers weigh the impact of growth, employment, and energy prices on inflation. For gold, this directly impacts real interest rate expectations and is a major macroeconomic source of recent price volatility. The impact of the current Middle East situation on gold differs significantly from traditional safe-haven events. The core variable has expanded from simple risk sentiment to the energy supply chain. The Strait of Hormuz previously handled about one-fifth of global oil and gas transport, and negotiations regarding shipping routes and navigation rules have yet to reach a stable conclusion. While relevant parties have discussed new shipping arrangements, progress on agreements does not guarantee an immediate return to normal commercial transport. This makes crude oil a crucial intermediate variable for observing gold prices. After a significant rise last week, Brent crude continued to trade around $89 per barrel on Monday. Sustained high oil prices, on the one hand, strengthen inflation expectations, and on the other hand, may weaken economic activity; their effects on gold are not entirely the same. The former may push up long-term yields, increasing the opportunity cost of holding gold; the latter may increase market attention to a shift in monetary policy and the defensive nature of assets. Therefore, what the gold market should truly focus on now is not a single geopolitical headline, but whether the conflict continues to affect energy transport and how changes in oil prices ultimately feed back into inflation and Federal Reserve policy expectations. From a daily chart perspective, spot gold is currently priced at approximately $4395, with a recent high of $4449.65. The Bollinger Bands show the middle band at approximately $4153.75, the upper band at approximately $4454.90, and the lower band at approximately $3852.61. The price has clearly moved away from the middle band and is approaching the upper band, while the upper Bollinger Band has also risen again, reflecting a significant increase in recent volatility. This structure firstly indicates that the market has shifted from a consolidation phase around $4,000 to a more volatile state, rather than simply suggesting that prices are in a definite direction. After prices deviate continuously from the middle band, short-term fluctuations typically become significantly more sensitive to news and interest rate changes. Regarding the MACD, the DIFF is around 74.00, the DEA is around 42.75, and the histogram is around 62.51; both lines are above the zero line, indicating that the previously formed upward momentum has not completely disappeared. However, observing recent candlestick patterns, the price body shortened significantly after reaching around $4,400, and the upper and lower shadows increased, suggesting that divergence in high-level trading is widening.
- Risk Warning and Disclaimer
- The market involves risk, and trading may not be suitable for all investors. This article is for reference only and does not constitute personal investment advice, nor does it take into account certain users’ specific investment objectives, financial situation, or other needs. Any investment decisions made based on this information are at your own risk.