The spot premium has widened dramatically, and the copper market is trading another kind of scarcity.
2026-08-17 21:08:56
On Monday, August 17th, copper prices on the London Metal Exchange remained high. Data showed that three-month copper rose to approximately $14,396 per tonne, approaching the previous record high of $14,545 per tonne. Meanwhile, exchange copper inventories fell to 204,975 tons, a low since February, after 42 consecutive trading days of decline, the longest continuous destocking period since 2014. The most noteworthy aspect of the current copper market is not simply the absolute price, but the simultaneous abnormal tightness in spot supply, inventory, and delivery time. Unlike typical one-sided market movements driven by macroeconomic sentiment, this round of volatility is increasingly reflected in the term structure and the allocation of deliverable resources. The most significant recent change in the copper market is the substantial premium of near-term contracts relative to far-term contracts, a typical spot premium structure. On August 11th, the spot premium relative to the three-month contract was approximately $207.5 per tonne, but by August 14th, based on publicly available settlement data, it had reached $411 per tonne. These factors collectively point to the fact that the cost of immediately obtaining deliverable copper has increased significantly.  The financial implications of this structure differ from simple price increases. The price of the far-month contract reflects the market's comprehensive pricing of future supply and demand, funding costs, and inventory costs. A significant premium in the spot market over the far-month contract indicates that holding the physical commodity itself generates substantial convenience benefits. For the industry chain, metals that can be immediately used for fulfillment, processing, or delivery have a marginal value far exceeding the book value of forward supply. Exchange inventories are currently around 204,975 tons, a decrease of about 18% from 249,850 tons at the end of July, and a substantial drop from the May high. More importantly, some inventories have been locked by cancelled warrants, meaning that although these metals are still counted within the warehouse system, they are ready to leave the warehouses, and the actual amount available for reallocation in the financial market is lower than the total inventory figure. This constitutes the most easily misinterpreted aspect of the current copper market. Global visible inventories have not fallen to historical extreme levels, but a large amount of copper has been concentrated in the US market to cope with potential changes in import policies. Previously released data showed that the US storage system has accumulated more than 570,000 tons of copper, resulting in a significant imbalance in the geographical distribution of global visible inventories. For futures pricing, total inventory and inventory availability are not the same concept. One ton of copper stored outside the delivery system, with its intended use locked in, or with high cross-regional transportation costs, cannot completely replace one ton of copper in exchange warehouses that can be delivered immediately. This explains why we currently see two seemingly contradictory phenomena: there is no shortage of copper globally, yet near-month copper in the London market is unusually expensive. What is truly scarce is the standard metal that can enter the delivery system within a specific location and time window. In recent months, the cross-regional flow of copper has been significantly affected by the potential US refined copper import policy. There is a persistent economic incentive to ship copper to the US; as long as the local price premium can cover transportation, financing, and storage costs, traders are motivated to redirect metals that could otherwise enter other markets. This type of arbitrage does not directly reduce the total global copper supply, but it alters the inventory distribution between different trading centers. The result is a rapid accumulation of inventory in some regional warehouses, while the London system continues to destock. Relevant data shows that previously, US copper imports and inventories increased significantly, while London system inventories decreased simultaneously; this regional mismatch has persisted for several months. Traditional supply and demand analysis typically focuses on mine output, refined product, and end-user consumption. However, when cross-market arbitrage is sufficiently large, logistics itself becomes a short-term pricing variable. At this point, price not only determines consumption but also the flow of metals. In other words, the core of the current copper market is not a sudden surge in demand, but rather a redistribution of inventory resulting from the combined effects of inventory, policy expectations, delivery deadlines, and cross-regional arbitrage. Observing the daily chart, copper prices previously experienced a continuous rise and consistently traded above the Bollinger Band's middle band, with the upper band significantly expanding upwards. In the chart, the Bollinger Band middle band is approximately $13,846/ton, and the upper band is approximately $14,346/ton. The price's recent movement to the vicinity or even outside the upper band indicates that recent volatility is significantly higher than before.
 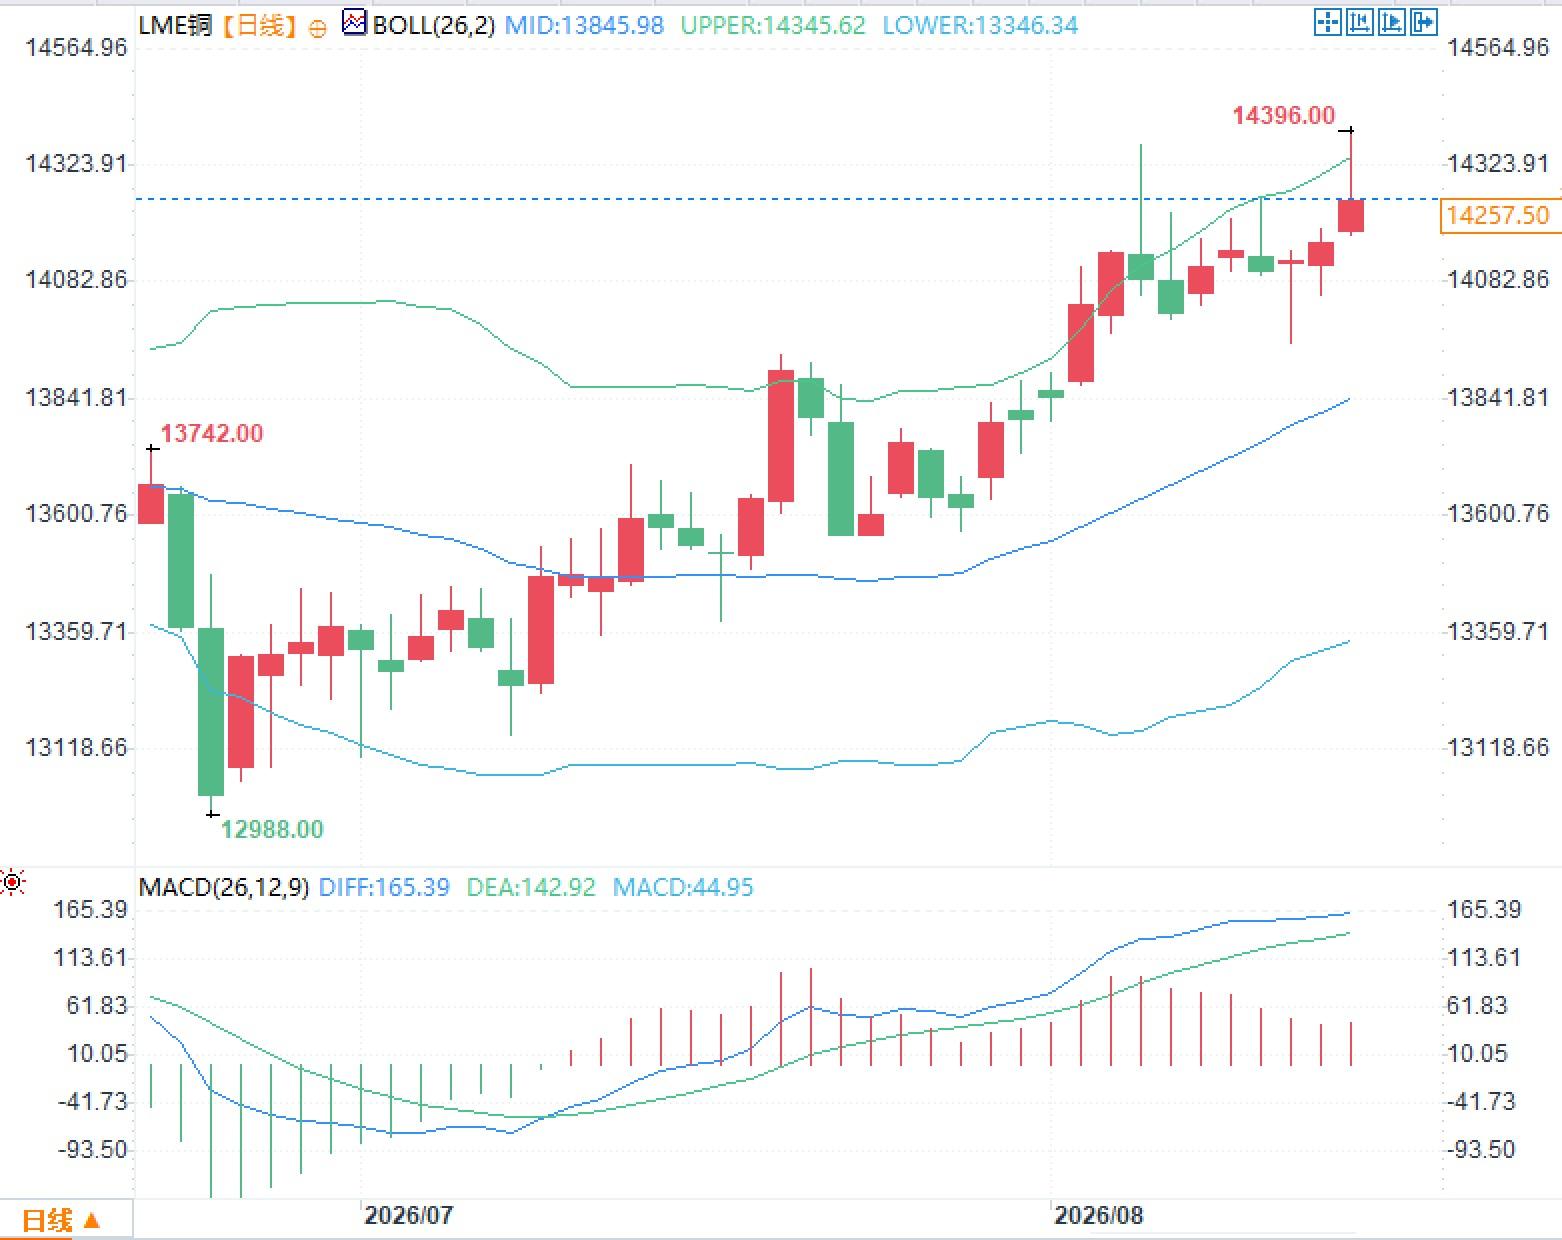 In terms of MACD, both DIFF and DEA are above the zero axis, indicating that the price changes in the previous period were strongly trend-driven; at the same time, the height of the bars has converged from the previous peak, reflecting that the speed of short-term price changes has changed differently from the previous acceleration phase.
The financial implications of this structure differ from simple price increases. The price of the far-month contract reflects the market's comprehensive pricing of future supply and demand, funding costs, and inventory costs. A significant premium in the spot market over the far-month contract indicates that holding the physical commodity itself generates substantial convenience benefits. For the industry chain, metals that can be immediately used for fulfillment, processing, or delivery have a marginal value far exceeding the book value of forward supply. Exchange inventories are currently around 204,975 tons, a decrease of about 18% from 249,850 tons at the end of July, and a substantial drop from the May high. More importantly, some inventories have been locked by cancelled warrants, meaning that although these metals are still counted within the warehouse system, they are ready to leave the warehouses, and the actual amount available for reallocation in the financial market is lower than the total inventory figure. This constitutes the most easily misinterpreted aspect of the current copper market. Global visible inventories have not fallen to historical extreme levels, but a large amount of copper has been concentrated in the US market to cope with potential changes in import policies. Previously released data showed that the US storage system has accumulated more than 570,000 tons of copper, resulting in a significant imbalance in the geographical distribution of global visible inventories. For futures pricing, total inventory and inventory availability are not the same concept. One ton of copper stored outside the delivery system, with its intended use locked in, or with high cross-regional transportation costs, cannot completely replace one ton of copper in exchange warehouses that can be delivered immediately. This explains why we currently see two seemingly contradictory phenomena: there is no shortage of copper globally, yet near-month copper in the London market is unusually expensive. What is truly scarce is the standard metal that can enter the delivery system within a specific location and time window. In recent months, the cross-regional flow of copper has been significantly affected by the potential US refined copper import policy. There is a persistent economic incentive to ship copper to the US; as long as the local price premium can cover transportation, financing, and storage costs, traders are motivated to redirect metals that could otherwise enter other markets. This type of arbitrage does not directly reduce the total global copper supply, but it alters the inventory distribution between different trading centers. The result is a rapid accumulation of inventory in some regional warehouses, while the London system continues to destock. Relevant data shows that previously, US copper imports and inventories increased significantly, while London system inventories decreased simultaneously; this regional mismatch has persisted for several months. Traditional supply and demand analysis typically focuses on mine output, refined product, and end-user consumption. However, when cross-market arbitrage is sufficiently large, logistics itself becomes a short-term pricing variable. At this point, price not only determines consumption but also the flow of metals. In other words, the core of the current copper market is not a sudden surge in demand, but rather a redistribution of inventory resulting from the combined effects of inventory, policy expectations, delivery deadlines, and cross-regional arbitrage. Observing the daily chart, copper prices previously experienced a continuous rise and consistently traded above the Bollinger Band's middle band, with the upper band significantly expanding upwards. In the chart, the Bollinger Band middle band is approximately $13,846/ton, and the upper band is approximately $14,346/ton. The price's recent movement to the vicinity or even outside the upper band indicates that recent volatility is significantly higher than before. In terms of MACD, both DIFF and DEA are above the zero axis, indicating that the price changes in the previous period were strongly trend-driven; at the same time, the height of the bars has converged from the previous peak, reflecting that the speed of short-term price changes has changed differently from the previous acceleration phase.
- Risk Warning and Disclaimer
- The market involves risk, and trading may not be suitable for all investors. This article is for reference only and does not constitute personal investment advice, nor does it take into account certain users’ specific investment objectives, financial situation, or other needs. Any investment decisions made based on this information are at your own risk.