High 20-year yields failed to boost the dollar index.
2026-08-19 01:46:57
The highest yield on long-term U.S. Treasury bonds in nearly two decades only pushed the dollar index up by 0.03 points. Spot prices barely held above 99.50, with a daily trading range of only 17 points; the index continued to trade below the 200-day exponential moving average (EMA, approximately 99.75), which has suppressed every upward attempt over the past two weeks.  The expected interest rate advantage failed to materialize. The yield on the 30-year US Treasury note climbed to around 5.3%, a new high since June 2007. Normally, this alone should have been beneficial to the US dollar, but it didn't. The reason is that yields rose simultaneously in global markets. The yield on the 10-year Japanese government bond hit a 30-year high; the yield on the 30-year German government bond reached its strongest level since 2011; the yield on the 30-year French government bond returned to a level not seen since 2008; and long-term yields in the UK, Italy, Switzerland, and Canada also rose. Exchange rates are relative prices, but this round represents a globally synchronized absolute rise in yields. Only when a country's yield rises faster than its counterparty's currency will a rise in yields benefit its own currency. The simultaneous expansion of global term premiums did not create a relative interest rate advantage for any currency. The euro accounts for 57.6% of the US dollar index, and the simultaneous selling of German long-term bonds and US Treasuries alone offset more than half of the dollar index's weighting, not even considering the other five currencies. The performance of the yen sector can hardly be described as neutral. With the yen accounting for 13.6% of the index, and Japanese bond yields reaching over 30-year highs, this could prompt the world's largest pool of overseas capital to flow back home, ceasing to provide carry trade funds abroad. Adding the weighting of the pound and the Canadian dollar—both with recently rising long-term yields—over 80% of the currencies in the dollar index are being repriced by the same force. Policy expectations that previously supported the dollar are now turning downwards . What truly dominates currency pricing is the policy expectation component of the yield curve, and current expectations are negative for the dollar. Interest rate futures imply a 65.4% probability of keeping rates unchanged on September 16th, a 52.4% probability on October 28th, and a 33.0% probability on December 9th. On August 10th, the market was still certain of a December rate hike. In just eight trading days, the market has already priced in about one-third of the expected interest rate hikes. Interest rate expectations for each FOMC meeting in 2026 have not yet factored in rate cuts, with the earliest rate cut expectation not appearing until 2027. This does not indicate the start of a rate-cutting cycle, but rather a postponement of the timing of rate hikes. This has both deprived the dollar of its carry trade logic and failed to generate enough economic recession fears to protect the dollar. Data released on Tuesday also did not support rate hike expectations. US housing starts in July were 1.239 million units, below the market expectation of 1.35 million units and the previous value of 1.415 million units; pending home sales fell 2.3% month-on-month, while the market had expected a 0.3% increase; industrial production rose 0.2% month-on-month, lower than the expected 0.3%. Only the August New York Fed Manufacturing Index released on Monday showed a strong performance, recording 20.6, higher than the expected 11, but the optimistic sentiment in the survey will not be priced into the interest rate market. Safe-haven buying was also absent . Influenced by similar news that pushed up long-term yields, market risk appetite weakened during the Asian and European trading sessions. Washington has confirmed that the United States has neither engaged in nor plans to engage in negotiations with Iran, the naval blockade remains in place, and international crude oil prices have climbed above the $85 mark. Over the past five years, this combination should have been bullish for the dollar, but the dollar index has remained stagnant. Against this backdrop, the narrow 17-point fluctuation does not indicate market calm, but rather that the market has run out of further trading narratives. Since its high of nearly 101.75 at the end of June, the dollar index has been oscillating around the 200-day moving average for the past two weeks. The daily Stochastic Relative Strength Index (StochRSI) is near 14, remaining at the bottom of its range for the second consecutive week, yet no rebound signal has emerged. This suggests that the bears are merely maintaining patience, not that their strength has been exhausted. Key events to follow this week : On Wednesday at 18:00 GMT, the minutes of the Federal Reserve's July 28-29 FOMC meeting will be released, the first high-impact event of the week. At the July meeting, three Federal Reserve governors voted to raise interest rates by 25 basis points; the market has already priced in this rate hike over the past three weeks, so this release of the minutes will be used to test the actual isolation of this small group of hawkish officials. Initial jobless claims data will be released on Thursday, with the market expecting 210,000, compared to 209,000 previously; the Philadelphia Fed manufacturing survey forecast has fallen from 41.4 to 25, nearly halved. The preliminary August PMI figures will be released on Friday, the second most influential data point of the week and the only composite survey data that could significantly change September interest rate pricing: the manufacturing PMI is expected to be 53.8 (previous 53.9), and the services PMI is expected to be 54 (previous 54.6). Key levels for the US dollar index .
 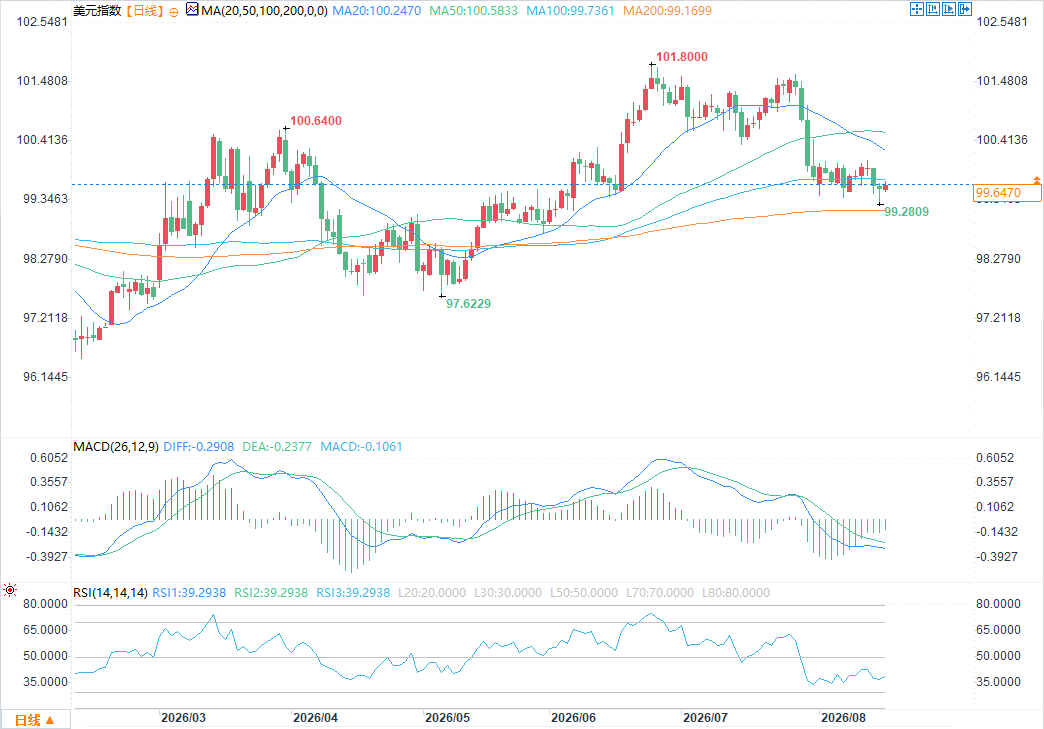 Resistance: The 200-day exponential moving average around 99.75 provides direct resistance; above that is the psychological level of 100.00; the declining 50-day exponential moving average is around 100.25. A daily close above this level would signal the end of the current downtrend. Support: Current intraday support is at 99.50; a break below this level would target 99.25; the next target is the late May low of 98.75. Outlook: Bearish on the US dollar. Global long-term yields are being repriced in tandem, and the relative interest rate advantage that supported the US dollar is disappearing. The price has been trading in a narrow range of 17 points below the 200-day exponential moving average, indicating a potential downward breakout rather than bottom formation. Only a daily close above 100.25 would invalidate the bearish logic.
The expected interest rate advantage failed to materialize. The yield on the 30-year US Treasury note climbed to around 5.3%, a new high since June 2007. Normally, this alone should have been beneficial to the US dollar, but it didn't. The reason is that yields rose simultaneously in global markets. The yield on the 10-year Japanese government bond hit a 30-year high; the yield on the 30-year German government bond reached its strongest level since 2011; the yield on the 30-year French government bond returned to a level not seen since 2008; and long-term yields in the UK, Italy, Switzerland, and Canada also rose. Exchange rates are relative prices, but this round represents a globally synchronized absolute rise in yields. Only when a country's yield rises faster than its counterparty's currency will a rise in yields benefit its own currency. The simultaneous expansion of global term premiums did not create a relative interest rate advantage for any currency. The euro accounts for 57.6% of the US dollar index, and the simultaneous selling of German long-term bonds and US Treasuries alone offset more than half of the dollar index's weighting, not even considering the other five currencies. The performance of the yen sector can hardly be described as neutral. With the yen accounting for 13.6% of the index, and Japanese bond yields reaching over 30-year highs, this could prompt the world's largest pool of overseas capital to flow back home, ceasing to provide carry trade funds abroad. Adding the weighting of the pound and the Canadian dollar—both with recently rising long-term yields—over 80% of the currencies in the dollar index are being repriced by the same force. Policy expectations that previously supported the dollar are now turning downwards . What truly dominates currency pricing is the policy expectation component of the yield curve, and current expectations are negative for the dollar. Interest rate futures imply a 65.4% probability of keeping rates unchanged on September 16th, a 52.4% probability on October 28th, and a 33.0% probability on December 9th. On August 10th, the market was still certain of a December rate hike. In just eight trading days, the market has already priced in about one-third of the expected interest rate hikes. Interest rate expectations for each FOMC meeting in 2026 have not yet factored in rate cuts, with the earliest rate cut expectation not appearing until 2027. This does not indicate the start of a rate-cutting cycle, but rather a postponement of the timing of rate hikes. This has both deprived the dollar of its carry trade logic and failed to generate enough economic recession fears to protect the dollar. Data released on Tuesday also did not support rate hike expectations. US housing starts in July were 1.239 million units, below the market expectation of 1.35 million units and the previous value of 1.415 million units; pending home sales fell 2.3% month-on-month, while the market had expected a 0.3% increase; industrial production rose 0.2% month-on-month, lower than the expected 0.3%. Only the August New York Fed Manufacturing Index released on Monday showed a strong performance, recording 20.6, higher than the expected 11, but the optimistic sentiment in the survey will not be priced into the interest rate market. Safe-haven buying was also absent . Influenced by similar news that pushed up long-term yields, market risk appetite weakened during the Asian and European trading sessions. Washington has confirmed that the United States has neither engaged in nor plans to engage in negotiations with Iran, the naval blockade remains in place, and international crude oil prices have climbed above the $85 mark. Over the past five years, this combination should have been bullish for the dollar, but the dollar index has remained stagnant. Against this backdrop, the narrow 17-point fluctuation does not indicate market calm, but rather that the market has run out of further trading narratives. Since its high of nearly 101.75 at the end of June, the dollar index has been oscillating around the 200-day moving average for the past two weeks. The daily Stochastic Relative Strength Index (StochRSI) is near 14, remaining at the bottom of its range for the second consecutive week, yet no rebound signal has emerged. This suggests that the bears are merely maintaining patience, not that their strength has been exhausted. Key events to follow this week : On Wednesday at 18:00 GMT, the minutes of the Federal Reserve's July 28-29 FOMC meeting will be released, the first high-impact event of the week. At the July meeting, three Federal Reserve governors voted to raise interest rates by 25 basis points; the market has already priced in this rate hike over the past three weeks, so this release of the minutes will be used to test the actual isolation of this small group of hawkish officials. Initial jobless claims data will be released on Thursday, with the market expecting 210,000, compared to 209,000 previously; the Philadelphia Fed manufacturing survey forecast has fallen from 41.4 to 25, nearly halved. The preliminary August PMI figures will be released on Friday, the second most influential data point of the week and the only composite survey data that could significantly change September interest rate pricing: the manufacturing PMI is expected to be 53.8 (previous 53.9), and the services PMI is expected to be 54 (previous 54.6). Key levels for the US dollar index . Resistance: The 200-day exponential moving average around 99.75 provides direct resistance; above that is the psychological level of 100.00; the declining 50-day exponential moving average is around 100.25. A daily close above this level would signal the end of the current downtrend. Support: Current intraday support is at 99.50; a break below this level would target 99.25; the next target is the late May low of 98.75. Outlook: Bearish on the US dollar. Global long-term yields are being repriced in tandem, and the relative interest rate advantage that supported the US dollar is disappearing. The price has been trading in a narrow range of 17 points below the 200-day exponential moving average, indicating a potential downward breakout rather than bottom formation. Only a daily close above 100.25 would invalidate the bearish logic.
- Risk Warning and Disclaimer
- The market involves risk, and trading may not be suitable for all investors. This article is for reference only and does not constitute personal investment advice, nor does it take into account certain users’ specific investment objectives, financial situation, or other needs. Any investment decisions made based on this information are at your own risk.