Why did gold suddenly fluctuate by $100? Long-term bond repurchase agreements suddenly doubled.
2026-08-19 21:36:57
On Wednesday, August 19th, the market experienced a significant cross-asset repricing. Previously, long-term Treasury bonds had been under sustained pressure, with the 30-year US Treasury yield rising to near its highest level since 2007. The US Treasury subsequently announced an expansion of its long-term nominal Treasury liquidity support repurchase program, raising the single repurchase limit for both 10-20 year and 20-30 year maturities from $2 billion to at least $4 billion, scheduled to take effect on September 9th. Following the announcement, long-term Treasury yields quickly fell, with the 30-year yield dropping to approximately 5.20% and the 10-year yield to around 4.63%. This interest rate change rapidly transmitted to the precious metals market, with spot gold currently testing around $4460 per ounce. Understanding this gold price movement hinges not on simply establishing a linear logic that "Treasury bond purchases equal gold price increases," but rather on re-examining the actual holding costs of gold. Gold itself does not generate coupon income; therefore, the market typically compares the opportunity cost of holding gold with that of holding high-credit-rating fixed-income assets. Previously, the yield on 30-year Treasury bonds rose to around 5.3%, and long-term inflation expectations did not rise at the same rate, indicating a tightening real interest rate environment. This is also a key reason why gold has failed to exhibit the characteristics of a traditional safe-haven asset, given the continued existence of geopolitical risks.  On August 18, the yield on 30-year US Treasury bonds rose to around 5.327%, a high since 2007, while the 10-year yield was also near 4.7%. When the US Treasury announced an expansion of long-term repurchase agreements, the market first adjusted the liquidity risk premium and term premium of long-term bonds, rather than immediately reassessing the Federal Reserve's policy rate. This distinction is crucial. Treasury repurchase agreements are debt management and liquidity support measures, not equivalent to the Federal Reserve's asset purchases, and cannot be simply interpreted as quantitative easing. Their direct effect is to improve the liquidity of some existing bonds, provide additional buyer demand, and reduce the liquidity compensation required by the market during periods of concentrated supply pressure. As of the end of July, the cumulative scale of the US Treasury's long-term nominal bond liquidity support repurchase agreements had reached approximately $95 billion, indicating that the repurchase mechanism itself is not a new, temporary tool. What the market should truly pay attention to in this change is the significant increase in the size of a single long-term operation. This market movement once again demonstrates an easily overlooked fact: there is no stable one-to-one correspondence between gold and nominal Treasury yields; the real interest rate is the more important intermediate variable. During the significant decline in gold prices on August 18th, the market observed a rapid rise in long-term Treasury yields, while long-term inflation expectations remained relatively stable. When nominal yields rise faster than inflation expectations, real yields increase, and the relative opportunity cost of non-interest-bearing assets rises accordingly. Data at that time showed the 10-year inflation breakeven rate was approximately 2.30%. The logic reversed on August 19th. After the US Treasury expanded its repurchase operations, the 30-year yield fell significantly from the previous trading day's closing level of 5.284%, compressing the term premium previously priced in by the market. Simultaneously, the US dollar index weakened briefly, allowing gold to be repriced through both the interest rate and currency pricing channels. However, this does not mean that long-term interest rate risks have disappeared. Fiscal deficits, the scale of Treasury bond supply, corporate financing needs, and energy prices may still affect long-term term premiums. The US Treasury's quarterly financing arrangements announced in early August maintained a large-scale debt issuance while continuing to improve secondary market liquidity through repurchase agreements. Therefore, the current gold price reflects not simply an increase in the "safe-haven premium," but rather a concentrated correction of the previous trading day's valuation compression following a rapid adjustment in real interest rates. The most noteworthy contradiction in the long-term bond market is the simultaneous existence of increased liquidity support and structural supply pressure. While the Treasury's increased repurchase volume can improve market depth for existing bonds of specific maturities, it cannot directly change the overall demand for fiscal financing. Previous quarterly arrangements show that liquidity support repurchase volumes have consistently remained in the tens of billions of dollars, while the overall size of the US Treasury market has exceeded $30 trillion. Therefore, relative to the overall market stock, repurchases are more appropriately understood as a micro-structural tool rather than a tool to change the fundamentals of debt supply and demand. On the other hand, energy prices remain a variable in inflation. Recently, crude oil prices have remained high, and geopolitical tensions in the Strait of Hormuz have increased uncertainty in transportation and energy supply, leading bond investors to continue demanding higher long-term inflation risk compensation. Earlier on August 19, the 30-year US Treasury yield was still around 5.22%, and the 10-year yield was around 4.625%, indicating that although the long-term bond market has seen some recovery, the absolute level of interest rates remains high. This places gold in a complex macroeconomic situation: increased energy and geopolitical risks drive demand for safe-haven assets and inflation hedges, while high real interest rates raise the opportunity cost of holding gold. The coexistence of these two factors explains the significant intraday volatility in gold prices in recent trading days, rather than a smoother trend driven by a single macroeconomic variable. Observing the 10-minute chart, the most noticeable change in gold is not a price breakout, but rather a shift in volatility.
 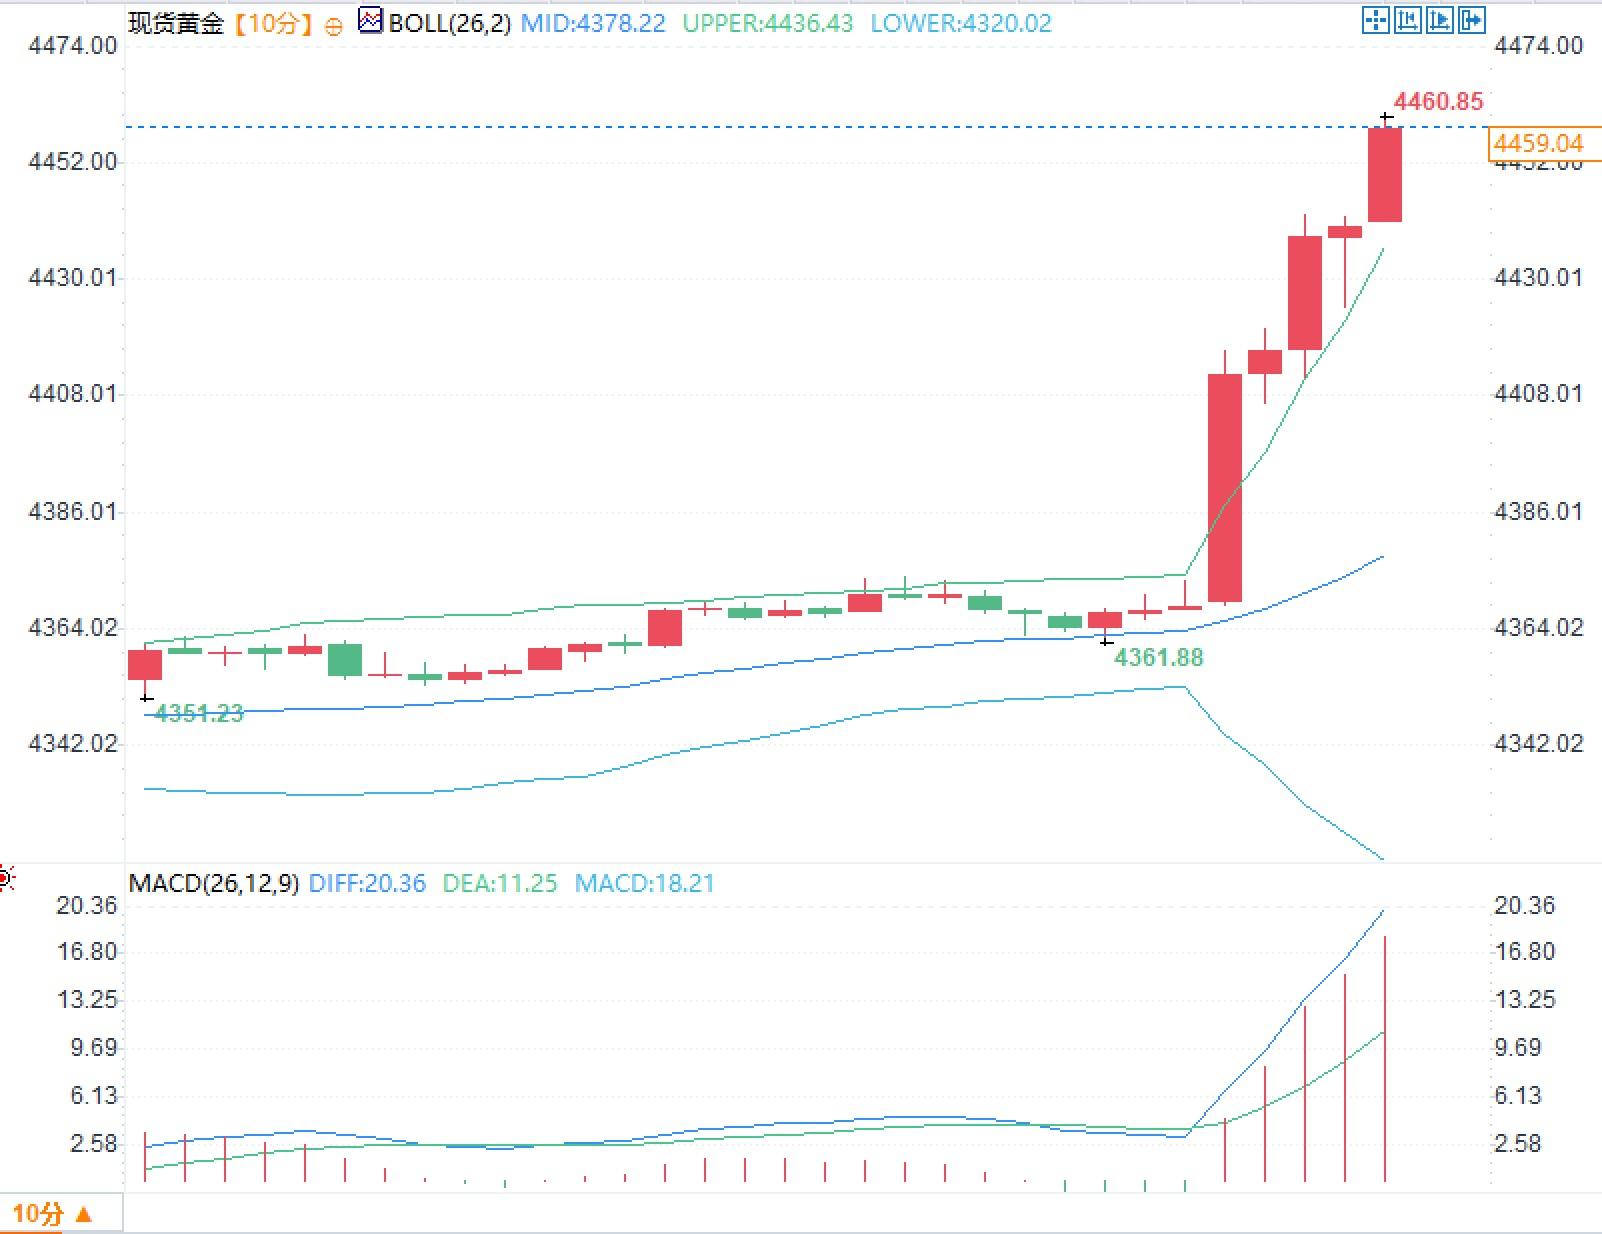 Previously, prices traded in a narrow range around the Bollinger Band's middle band for an extended period, followed by a series of candlesticks with significantly expanded bodies. The upper Bollinger Band rapidly widened, and the middle band rose in tandem. Currently, the middle Bollinger Band is around $4378/oz, and the upper band is around $4436/oz, with prices briefly trading significantly outside the upper band. This typically indicates that short-term actual volatility has exceeded the previously statistical range, rather than simply representing trend strength. The MACD also shows a rapid expansion of short-term momentum, with a significant widening of the gap between the DIFF and DEA lines and a rapid rise in the histogram. Currently, gold, long-term Treasury bonds, and the US dollar are undergoing synchronized repricing following the Treasury's announcement, suggesting that this round of volatility is primarily driven by macroeconomic interest rate factors, rather than independent factors within the gold market. Therefore, subsequent observation will focus on real yields, term premiums, Treasury auction demand, energy prices, and the Fed's description of the policy function in the meeting minutes.
On August 18, the yield on 30-year US Treasury bonds rose to around 5.327%, a high since 2007, while the 10-year yield was also near 4.7%. When the US Treasury announced an expansion of long-term repurchase agreements, the market first adjusted the liquidity risk premium and term premium of long-term bonds, rather than immediately reassessing the Federal Reserve's policy rate. This distinction is crucial. Treasury repurchase agreements are debt management and liquidity support measures, not equivalent to the Federal Reserve's asset purchases, and cannot be simply interpreted as quantitative easing. Their direct effect is to improve the liquidity of some existing bonds, provide additional buyer demand, and reduce the liquidity compensation required by the market during periods of concentrated supply pressure. As of the end of July, the cumulative scale of the US Treasury's long-term nominal bond liquidity support repurchase agreements had reached approximately $95 billion, indicating that the repurchase mechanism itself is not a new, temporary tool. What the market should truly pay attention to in this change is the significant increase in the size of a single long-term operation. This market movement once again demonstrates an easily overlooked fact: there is no stable one-to-one correspondence between gold and nominal Treasury yields; the real interest rate is the more important intermediate variable. During the significant decline in gold prices on August 18th, the market observed a rapid rise in long-term Treasury yields, while long-term inflation expectations remained relatively stable. When nominal yields rise faster than inflation expectations, real yields increase, and the relative opportunity cost of non-interest-bearing assets rises accordingly. Data at that time showed the 10-year inflation breakeven rate was approximately 2.30%. The logic reversed on August 19th. After the US Treasury expanded its repurchase operations, the 30-year yield fell significantly from the previous trading day's closing level of 5.284%, compressing the term premium previously priced in by the market. Simultaneously, the US dollar index weakened briefly, allowing gold to be repriced through both the interest rate and currency pricing channels. However, this does not mean that long-term interest rate risks have disappeared. Fiscal deficits, the scale of Treasury bond supply, corporate financing needs, and energy prices may still affect long-term term premiums. The US Treasury's quarterly financing arrangements announced in early August maintained a large-scale debt issuance while continuing to improve secondary market liquidity through repurchase agreements. Therefore, the current gold price reflects not simply an increase in the "safe-haven premium," but rather a concentrated correction of the previous trading day's valuation compression following a rapid adjustment in real interest rates. The most noteworthy contradiction in the long-term bond market is the simultaneous existence of increased liquidity support and structural supply pressure. While the Treasury's increased repurchase volume can improve market depth for existing bonds of specific maturities, it cannot directly change the overall demand for fiscal financing. Previous quarterly arrangements show that liquidity support repurchase volumes have consistently remained in the tens of billions of dollars, while the overall size of the US Treasury market has exceeded $30 trillion. Therefore, relative to the overall market stock, repurchases are more appropriately understood as a micro-structural tool rather than a tool to change the fundamentals of debt supply and demand. On the other hand, energy prices remain a variable in inflation. Recently, crude oil prices have remained high, and geopolitical tensions in the Strait of Hormuz have increased uncertainty in transportation and energy supply, leading bond investors to continue demanding higher long-term inflation risk compensation. Earlier on August 19, the 30-year US Treasury yield was still around 5.22%, and the 10-year yield was around 4.625%, indicating that although the long-term bond market has seen some recovery, the absolute level of interest rates remains high. This places gold in a complex macroeconomic situation: increased energy and geopolitical risks drive demand for safe-haven assets and inflation hedges, while high real interest rates raise the opportunity cost of holding gold. The coexistence of these two factors explains the significant intraday volatility in gold prices in recent trading days, rather than a smoother trend driven by a single macroeconomic variable. Observing the 10-minute chart, the most noticeable change in gold is not a price breakout, but rather a shift in volatility. Previously, prices traded in a narrow range around the Bollinger Band's middle band for an extended period, followed by a series of candlesticks with significantly expanded bodies. The upper Bollinger Band rapidly widened, and the middle band rose in tandem. Currently, the middle Bollinger Band is around $4378/oz, and the upper band is around $4436/oz, with prices briefly trading significantly outside the upper band. This typically indicates that short-term actual volatility has exceeded the previously statistical range, rather than simply representing trend strength. The MACD also shows a rapid expansion of short-term momentum, with a significant widening of the gap between the DIFF and DEA lines and a rapid rise in the histogram. Currently, gold, long-term Treasury bonds, and the US dollar are undergoing synchronized repricing following the Treasury's announcement, suggesting that this round of volatility is primarily driven by macroeconomic interest rate factors, rather than independent factors within the gold market. Therefore, subsequent observation will focus on real yields, term premiums, Treasury auction demand, energy prices, and the Fed's description of the policy function in the meeting minutes.
- Risk Warning and Disclaimer
- The market involves risk, and trading may not be suitable for all investors. This article is for reference only and does not constitute personal investment advice, nor does it take into account certain users’ specific investment objectives, financial situation, or other needs. Any investment decisions made based on this information are at your own risk.