Nearly 70% of copper inventories on exchanges are concentrated in the United States, and some of this copper may become "stagnant inventory."
2026-08-19 21:54:58
The United States consumes only 6-7% of global copper, yet it now holds nearly 70% of the world's visible copper inventory on exchanges. Ole Hansen, head of commodities strategy at Saxo Bank, said that some of this inventory may remain in the United States for an extended period. 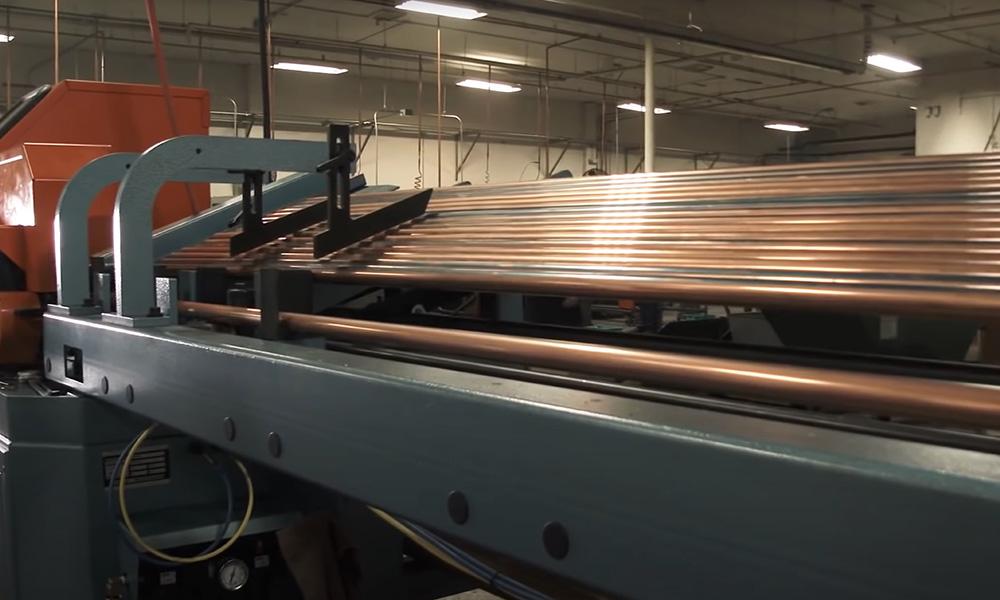 According to Ole Hansen's calculations, the United States accounts for only 6%-7% of global copper consumption. However, nearly 70% of the copper inventories reported by the world's three major futures exchanges are now held by the United States. "Looking at the world's three major futures exchanges—the New York COMEX, the London LME, and the Shanghai Futures Exchange—COMEX's inventory accounts for nearly 70% of the total inventory across the three exchanges, an unprecedented situation," said Hansen, head of commodity strategy at Saxo Bank. The direct driving factor is tariff risk, which has been further amplified by demand from the Chinese market. Hansen stated that the London market is caught in a dilemma between two factors. The U.S. Department of Commerce has proposed a phased tariff on imported refined copper, with a rate of 15% in 2027 and increasing to 30% in 2028. Seven weeks have passed since the deadline for submitting the proposal, and the U.S. government has yet to make a final decision. But traders are no longer waiting; the logic is simple: ship copper into the United States before the tariffs take effect, and the value of this batch of copper will immediately rise once the tariffs are implemented. “As long as traders can get copper, they want to ship the metal into the US to avoid tariffs,” Hansen said, “because the value of the copper they hold will increase after the tariffs are implemented.” Meanwhile, forces from Asia are creating a counter-pull. “We’re seeing a recovery in Chinese demand,” he said. “China is at the forefront of the energy transition, and its copper demand remains very strong.” He also acknowledged that US stockpiles could potentially flow out in the future. If copper prices outside the US rise to a sufficient level, the arbitrage logic reverses, and copper will be exported. But Hansen said this scenario has failed once before. “Last year, we thought this would happen: a large amount of copper flooded into the US before the tariff news, but then the tariffs were postponed,” he said. “But in the months that followed, almost none of that copper shipped into the US left the country.” “Therefore, the risk is that this copper flowing into the US could almost become ‘stuck inventory,’ which would continue to exacerbate the copper supply shortage in other parts of the world.” The London Metal Exchange (LME), which is responsible for industrial metal pricing and physical delivery, publishes warehouse inventory data every morning. At Monday’s close, total LME inventory was 207,825 tons. Slightly more than half, or 104,750 tons, have generated cancelled warrants, indicating that owners are ready to take delivery of the metal. Approximately 63% of the cancelled warrant inventory is stored in US warehouses, with 45,625 tons held in New Orleans alone. On Monday, the copper spot premium over the three-month contract reached $535 per ton, the largest spread since 2021. Traders refer to this spot premium pattern as a spot premium (the spot price is higher than the forward contract price), which typically indicates that buyers urgently need physical delivery. Behind the spread: The actual gap isn't as large as it appears. The huge premium of $535 per ton is almost entirely concentrated on a single delivery date. Looking further down the forward curve, market tension has almost completely subsided. The September contract's premium over the March contract is only about $57, and the September-October spread is about $30. Monday's contract settlement corresponds to the exchange's core monthly delivery date—Wednesday, when all short position holders either take physical delivery of copper or pay to close their positions. When asked whether the spread reflected a genuine supply shortage or a concentrated short covering, Hansen believed it was both, but the latter was dominant. “A large number of traders are closing out their positions,” he said. “As the delivery date approaches, most large institutions have already rolled over their positions to the next month’s contract and won’t remain in the near-month contract.” He acknowledged that there was indeed some physical tightness in the market, but questioned the actual scale of the tightness. “The spread does reflect some short covering and supply shortages, but I doubt the actual tonnage of copper involved,” Hansen stated. “What’s causing this round of spot premiums may not be a gap of millions of tons, but perhaps just a relatively limited inventory change.” A similar spread occurred in 2021, at which time the LME implemented emergency measures to curb runaway prices. Hansen believes this will not be repeated this time. “We’re far from that point,” he said. “The nickel market is very small, and we’ve seen nickel prices squeezed so badly that regulators had to intervene. Copper, on the other hand, is the global benchmark commodity.” The supply side remains a thorny issue . BHP Billiton reported on Monday that copper revenue accounted for more than half of the company’s total revenue for the first time, thanks to a 35% surge in the average selling price of copper. However, the report also showed that production at its Chilean mines declined due to lower ore grades. The Chilean National Copper Commission (Cochilco) predicts that Chilean copper production will decline by 2.6% this year. Hansen’s interpretation was straightforward: copper supply release is inherently very slow. “The problem lies in the project implementation cycle,” he said. “It takes several years from the discovery of a copper mine to the production of the first ton of copper. In the past few years, mining companies have focused on mergers and acquisitions rather than capacity expansion.” “At the same time, ore grades continue to decline, and the costs of energy, steel, and other mining are constantly rising. Multiple unfavorable factors are compounded, while global demand for copper is currently at a historical high.” BHP Billiton’s CEO calculated this week: the cost of building a new copper mine project is as high as $16,000-$30,000 per ton; acquiring companies that own copper resources, including the acquisition premium, will cost well over $100,000 per ton. This cost gap has been a challenge for the industry for many years. Hansen believes that the industry has not seen a new wave of mine construction due to both corporate strategic priorities and the real constraints of geological resources. “I believe corporate funds have been diverted to other areas, and high-grade, easily exploitable copper mines have already been exhausted,” he said. “New copper mining projects require huge capital investment and are very difficult to operate.” Copper and Gold: A Market Tied to Debt Data released by the Federal Reserve on Tuesday showed that U.S. industrial production grew for the second consecutive month, with the annualized growth rate of manufacturing in the second quarter reaching a new high since 2021. The computer and electronics industry grew 1.9% month-on-month, and commercial equipment grew 0.8%. However, real estate data went in the opposite direction. Single-family home starts fell to their lowest point since 2022. The construction industry has historically been one of the largest demand sectors for copper, and this data is alarming. U.S. factory capacity utilization remained at only around 76%. “It can be said that the foundation for this round of economic expansion is not broad,” Hansen said. “U.S. economic growth increasingly relies on the implementation and effectiveness of large-scale investments.” He proactively pointed out the correlation between copper and gold. “The increasing reliance on debt financing for investment in the economy is worrying. AI hyperscale companies are borrowing heavily, competing with governments for funds, directly pushing up bond yields.” AI hyperscale companies refer to the leading technology giants globally building AI data centers. In the past, these companies held large amounts of cash to earn interest; now, they are heavily borrowing, competing with US Treasury bonds in the same money market. This week, the yield on the 30-year US Treasury bond hit 5.32%, a new high since 2007; the financing cost of the 30-year French government bond returned to 2008 levels; and the financing cost of German long-term bonds hit a 15-year high. Logically, high yields are bearish for gold—gold itself does not generate interest income, and the higher the bond returns, the less attractive gold becomes. A month ago, gold prices were below $4,000; on Tuesday morning, they surged to $4,436 before falling back. Hansen stated that such divergences have occurred historically. “Looking back at 2022-2023, central banks around the world aggressively raised interest rates, and the US real yield turned positive, but gold did not fall. Logically, gold prices should have fallen another 5%-10%.” Real yield is the true return on bonds after adjusting for inflation. Generally, rising real yields put pressure on gold. But at that time, the main buyers didn't look at yield data at all; the buyers were central banks around the world. Hansen believes the market is currently experiencing a similar divergence. Western investors mostly watched gold through ETFs, only recently taking action, their trading logic still anchored to the dollar and funding costs; while buyers from other regions, primarily Asia, continued to buy gold, unconstrained by this logic. He stated that everyone in the market is finally starting to pay attention to another reality: "The US debt clock is ringing. Yesterday, US debt surpassed $40 trillion and is still climbing at an alarming rate. The debt level is too high to withstand further increases in yields, and the burden of interest payments will increase dramatically. In the past, the US could withstand high interest rates, but now it can't." "This is the core reason why investors are starting to demand higher risk premiums for long-term assets." His target price for gold comes with multiple conditions. "The target is $4,500, and the price needs to hold above the 200-day moving average," Hansen said. In addition, the market needs to see a de-escalation of the Iranian conflict and a cooling of inflation. "If these conditions are met, the price of gold could challenge $5,000 by the end of the year, and could potentially break historical highs next year." Regarding downside support, he is watching whether the $4,200 level can hold. Silver: Cautious but Not Bearish Silver rose nearly 2% the previous day, but fell about 3% on Tuesday. The Silver Institute predicts that silver will experience its sixth consecutive annual supply-demand gap this year, with a gap size of 46.3 million ounces, and a cumulative gap of about 762 million ounces since 2021. These are figures frequently cited by silver bulls. Hansen does not deny the accuracy of the data, but will not use it as the core basis for a bullish outlook. "The supply-demand gap cannot last forever; the market will inevitably react at a certain stage," he said. "But the reality is that 50% of silver demand comes from the industrial sector." This characteristic has both advantages and disadvantages. He stated that after the sharp drop in silver prices this winter, investment buying waned; and after silver prices broke through $100, the industrial sector also began to adjust its purchasing strategies. "After silver prices broke through $100, more and more reports indicate that industrial companies are starting to look for alternative materials to silver." His short-term judgment on silver is not bearish, but rather that he believes the upside potential will encounter resistance. “My view on silver is cautious in the next phase,” Hansen said. “If market momentum is strong, silver could follow gold toward $100; but at that level, the market will reassess and enter a consolidation phase, considering whether industrial demand can support such high prices.” He continues to track the gold-silver ratio (the number of silver ounces that can be exchanged for one ounce of gold), which is currently close to 68. Hansen pointed out that 73 is a key resistance level; many technical analysts believe that if it breaks through 73, the gold-silver ratio will move toward 100, meaning that silver will underperform gold, rather than follow its rise. Regarding investors who bought at above $121 in January and subsequently suffered a 50% price drop, he bluntly stated that the market was extremely brutal. “Many investors were trapped at high levels, entering the market too late, and within just a few weeks, the price nearly halved, resulting in heavy losses.” Two types of scarcity Tuesday's market clearly reflected this divergence: gold fell 1.4%, silver fell about 3%, and platinum fell by a similar margin. However, in the afternoon of Tuesday, copper reversed its earlier decline, rebounding to near its intraday high. Investors often use the copper-gold ratio as a barometer of "economic growth" and "risk aversion." Hansen argues this logic is failing because the two metals face fundamentally different scarcity characteristics. "Copper faces a physical supply shortage, supporting its price; investment metals like gold are 'monetary scarce,' with strong market demand for safe-haven assets. Central banks are the main buyers, and this group continues to expand." However, both scarcity levels have inherent limitations: copper is consumed industrially, and once prices rise sufficiently, engineers will develop alternatives; gold, stored in vaults, will not be depleted. He uses an extreme analogy, not a price prediction: "Theoretically, gold prices could reach $10,000; but industrial metal prices have a ceiling, and excessively high prices will suppress demand." If he could only hold one metal for five years, he would choose gold; if he could allocate to three, he would choose gold, platinum, and copper. He did not disclose his personal holdings, stating that his position would be "overweight, with limited reference value," and recommends that hard assets comprise 5%-10% of the portfolio. He mentioned that the Bloomberg Commodity Index has risen about 28% this year, the S&P 500 about 20%, and the commodity index has risen over 40% in the past 12 months. "Traditional commodities have performed exceptionally well this year, outperforming the highly popular Nasdaq index." Two major events will change his view on copper: first, the complete resolution of tariff risks and the return of US inventories to the global market; second, a more significant variable. "If the AI hype proves false, and the market realizes that massive investments cannot be converted into revenue, this will be the biggest shock to the entire copper market."
According to Ole Hansen's calculations, the United States accounts for only 6%-7% of global copper consumption. However, nearly 70% of the copper inventories reported by the world's three major futures exchanges are now held by the United States. "Looking at the world's three major futures exchanges—the New York COMEX, the London LME, and the Shanghai Futures Exchange—COMEX's inventory accounts for nearly 70% of the total inventory across the three exchanges, an unprecedented situation," said Hansen, head of commodity strategy at Saxo Bank. The direct driving factor is tariff risk, which has been further amplified by demand from the Chinese market. Hansen stated that the London market is caught in a dilemma between two factors. The U.S. Department of Commerce has proposed a phased tariff on imported refined copper, with a rate of 15% in 2027 and increasing to 30% in 2028. Seven weeks have passed since the deadline for submitting the proposal, and the U.S. government has yet to make a final decision. But traders are no longer waiting; the logic is simple: ship copper into the United States before the tariffs take effect, and the value of this batch of copper will immediately rise once the tariffs are implemented. “As long as traders can get copper, they want to ship the metal into the US to avoid tariffs,” Hansen said, “because the value of the copper they hold will increase after the tariffs are implemented.” Meanwhile, forces from Asia are creating a counter-pull. “We’re seeing a recovery in Chinese demand,” he said. “China is at the forefront of the energy transition, and its copper demand remains very strong.” He also acknowledged that US stockpiles could potentially flow out in the future. If copper prices outside the US rise to a sufficient level, the arbitrage logic reverses, and copper will be exported. But Hansen said this scenario has failed once before. “Last year, we thought this would happen: a large amount of copper flooded into the US before the tariff news, but then the tariffs were postponed,” he said. “But in the months that followed, almost none of that copper shipped into the US left the country.” “Therefore, the risk is that this copper flowing into the US could almost become ‘stuck inventory,’ which would continue to exacerbate the copper supply shortage in other parts of the world.” The London Metal Exchange (LME), which is responsible for industrial metal pricing and physical delivery, publishes warehouse inventory data every morning. At Monday’s close, total LME inventory was 207,825 tons. Slightly more than half, or 104,750 tons, have generated cancelled warrants, indicating that owners are ready to take delivery of the metal. Approximately 63% of the cancelled warrant inventory is stored in US warehouses, with 45,625 tons held in New Orleans alone. On Monday, the copper spot premium over the three-month contract reached $535 per ton, the largest spread since 2021. Traders refer to this spot premium pattern as a spot premium (the spot price is higher than the forward contract price), which typically indicates that buyers urgently need physical delivery. Behind the spread: The actual gap isn't as large as it appears. The huge premium of $535 per ton is almost entirely concentrated on a single delivery date. Looking further down the forward curve, market tension has almost completely subsided. The September contract's premium over the March contract is only about $57, and the September-October spread is about $30. Monday's contract settlement corresponds to the exchange's core monthly delivery date—Wednesday, when all short position holders either take physical delivery of copper or pay to close their positions. When asked whether the spread reflected a genuine supply shortage or a concentrated short covering, Hansen believed it was both, but the latter was dominant. “A large number of traders are closing out their positions,” he said. “As the delivery date approaches, most large institutions have already rolled over their positions to the next month’s contract and won’t remain in the near-month contract.” He acknowledged that there was indeed some physical tightness in the market, but questioned the actual scale of the tightness. “The spread does reflect some short covering and supply shortages, but I doubt the actual tonnage of copper involved,” Hansen stated. “What’s causing this round of spot premiums may not be a gap of millions of tons, but perhaps just a relatively limited inventory change.” A similar spread occurred in 2021, at which time the LME implemented emergency measures to curb runaway prices. Hansen believes this will not be repeated this time. “We’re far from that point,” he said. “The nickel market is very small, and we’ve seen nickel prices squeezed so badly that regulators had to intervene. Copper, on the other hand, is the global benchmark commodity.” The supply side remains a thorny issue . BHP Billiton reported on Monday that copper revenue accounted for more than half of the company’s total revenue for the first time, thanks to a 35% surge in the average selling price of copper. However, the report also showed that production at its Chilean mines declined due to lower ore grades. The Chilean National Copper Commission (Cochilco) predicts that Chilean copper production will decline by 2.6% this year. Hansen’s interpretation was straightforward: copper supply release is inherently very slow. “The problem lies in the project implementation cycle,” he said. “It takes several years from the discovery of a copper mine to the production of the first ton of copper. In the past few years, mining companies have focused on mergers and acquisitions rather than capacity expansion.” “At the same time, ore grades continue to decline, and the costs of energy, steel, and other mining are constantly rising. Multiple unfavorable factors are compounded, while global demand for copper is currently at a historical high.” BHP Billiton’s CEO calculated this week: the cost of building a new copper mine project is as high as $16,000-$30,000 per ton; acquiring companies that own copper resources, including the acquisition premium, will cost well over $100,000 per ton. This cost gap has been a challenge for the industry for many years. Hansen believes that the industry has not seen a new wave of mine construction due to both corporate strategic priorities and the real constraints of geological resources. “I believe corporate funds have been diverted to other areas, and high-grade, easily exploitable copper mines have already been exhausted,” he said. “New copper mining projects require huge capital investment and are very difficult to operate.” Copper and Gold: A Market Tied to Debt Data released by the Federal Reserve on Tuesday showed that U.S. industrial production grew for the second consecutive month, with the annualized growth rate of manufacturing in the second quarter reaching a new high since 2021. The computer and electronics industry grew 1.9% month-on-month, and commercial equipment grew 0.8%. However, real estate data went in the opposite direction. Single-family home starts fell to their lowest point since 2022. The construction industry has historically been one of the largest demand sectors for copper, and this data is alarming. U.S. factory capacity utilization remained at only around 76%. “It can be said that the foundation for this round of economic expansion is not broad,” Hansen said. “U.S. economic growth increasingly relies on the implementation and effectiveness of large-scale investments.” He proactively pointed out the correlation between copper and gold. “The increasing reliance on debt financing for investment in the economy is worrying. AI hyperscale companies are borrowing heavily, competing with governments for funds, directly pushing up bond yields.” AI hyperscale companies refer to the leading technology giants globally building AI data centers. In the past, these companies held large amounts of cash to earn interest; now, they are heavily borrowing, competing with US Treasury bonds in the same money market. This week, the yield on the 30-year US Treasury bond hit 5.32%, a new high since 2007; the financing cost of the 30-year French government bond returned to 2008 levels; and the financing cost of German long-term bonds hit a 15-year high. Logically, high yields are bearish for gold—gold itself does not generate interest income, and the higher the bond returns, the less attractive gold becomes. A month ago, gold prices were below $4,000; on Tuesday morning, they surged to $4,436 before falling back. Hansen stated that such divergences have occurred historically. “Looking back at 2022-2023, central banks around the world aggressively raised interest rates, and the US real yield turned positive, but gold did not fall. Logically, gold prices should have fallen another 5%-10%.” Real yield is the true return on bonds after adjusting for inflation. Generally, rising real yields put pressure on gold. But at that time, the main buyers didn't look at yield data at all; the buyers were central banks around the world. Hansen believes the market is currently experiencing a similar divergence. Western investors mostly watched gold through ETFs, only recently taking action, their trading logic still anchored to the dollar and funding costs; while buyers from other regions, primarily Asia, continued to buy gold, unconstrained by this logic. He stated that everyone in the market is finally starting to pay attention to another reality: "The US debt clock is ringing. Yesterday, US debt surpassed $40 trillion and is still climbing at an alarming rate. The debt level is too high to withstand further increases in yields, and the burden of interest payments will increase dramatically. In the past, the US could withstand high interest rates, but now it can't." "This is the core reason why investors are starting to demand higher risk premiums for long-term assets." His target price for gold comes with multiple conditions. "The target is $4,500, and the price needs to hold above the 200-day moving average," Hansen said. In addition, the market needs to see a de-escalation of the Iranian conflict and a cooling of inflation. "If these conditions are met, the price of gold could challenge $5,000 by the end of the year, and could potentially break historical highs next year." Regarding downside support, he is watching whether the $4,200 level can hold. Silver: Cautious but Not Bearish Silver rose nearly 2% the previous day, but fell about 3% on Tuesday. The Silver Institute predicts that silver will experience its sixth consecutive annual supply-demand gap this year, with a gap size of 46.3 million ounces, and a cumulative gap of about 762 million ounces since 2021. These are figures frequently cited by silver bulls. Hansen does not deny the accuracy of the data, but will not use it as the core basis for a bullish outlook. "The supply-demand gap cannot last forever; the market will inevitably react at a certain stage," he said. "But the reality is that 50% of silver demand comes from the industrial sector." This characteristic has both advantages and disadvantages. He stated that after the sharp drop in silver prices this winter, investment buying waned; and after silver prices broke through $100, the industrial sector also began to adjust its purchasing strategies. "After silver prices broke through $100, more and more reports indicate that industrial companies are starting to look for alternative materials to silver." His short-term judgment on silver is not bearish, but rather that he believes the upside potential will encounter resistance. “My view on silver is cautious in the next phase,” Hansen said. “If market momentum is strong, silver could follow gold toward $100; but at that level, the market will reassess and enter a consolidation phase, considering whether industrial demand can support such high prices.” He continues to track the gold-silver ratio (the number of silver ounces that can be exchanged for one ounce of gold), which is currently close to 68. Hansen pointed out that 73 is a key resistance level; many technical analysts believe that if it breaks through 73, the gold-silver ratio will move toward 100, meaning that silver will underperform gold, rather than follow its rise. Regarding investors who bought at above $121 in January and subsequently suffered a 50% price drop, he bluntly stated that the market was extremely brutal. “Many investors were trapped at high levels, entering the market too late, and within just a few weeks, the price nearly halved, resulting in heavy losses.” Two types of scarcity Tuesday's market clearly reflected this divergence: gold fell 1.4%, silver fell about 3%, and platinum fell by a similar margin. However, in the afternoon of Tuesday, copper reversed its earlier decline, rebounding to near its intraday high. Investors often use the copper-gold ratio as a barometer of "economic growth" and "risk aversion." Hansen argues this logic is failing because the two metals face fundamentally different scarcity characteristics. "Copper faces a physical supply shortage, supporting its price; investment metals like gold are 'monetary scarce,' with strong market demand for safe-haven assets. Central banks are the main buyers, and this group continues to expand." However, both scarcity levels have inherent limitations: copper is consumed industrially, and once prices rise sufficiently, engineers will develop alternatives; gold, stored in vaults, will not be depleted. He uses an extreme analogy, not a price prediction: "Theoretically, gold prices could reach $10,000; but industrial metal prices have a ceiling, and excessively high prices will suppress demand." If he could only hold one metal for five years, he would choose gold; if he could allocate to three, he would choose gold, platinum, and copper. He did not disclose his personal holdings, stating that his position would be "overweight, with limited reference value," and recommends that hard assets comprise 5%-10% of the portfolio. He mentioned that the Bloomberg Commodity Index has risen about 28% this year, the S&P 500 about 20%, and the commodity index has risen over 40% in the past 12 months. "Traditional commodities have performed exceptionally well this year, outperforming the highly popular Nasdaq index." Two major events will change his view on copper: first, the complete resolution of tariff risks and the return of US inventories to the global market; second, a more significant variable. "If the AI hype proves false, and the market realizes that massive investments cannot be converted into revenue, this will be the biggest shock to the entire copper market."
- Risk Warning and Disclaimer
- The market involves risk, and trading may not be suitable for all investors. This article is for reference only and does not constitute personal investment advice, nor does it take into account certain users’ specific investment objectives, financial situation, or other needs. Any investment decisions made based on this information are at your own risk.