Spot silver prices are fluctuating around $69, with a bullish technical outlook across the board but suggesting the upward momentum may be slowing.
2026-08-24 13:26:59
On Monday (August 24) during Asian trading hours, spot silver prices fluctuated around the $69 mark, with bulls and bears locked in a fierce battle. Despite limited short-term volatility, silver prices are just a step away from the two-month high of $70 reached last Friday, and technically, there are numerous bullish signals. How far can this rally, ignited by last week's key breakout, go? And what potential pitfalls should we be wary of? 
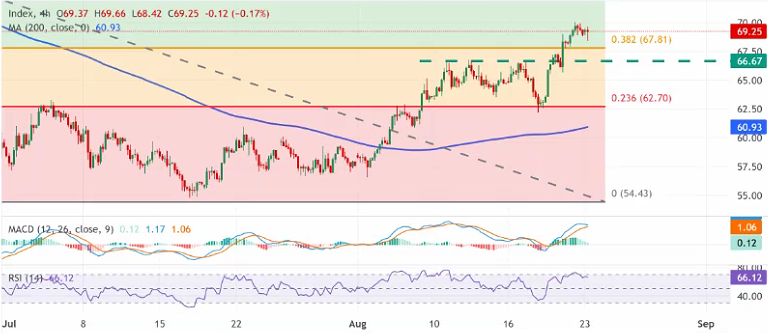 Chart: 4-hour chart of spot silver price
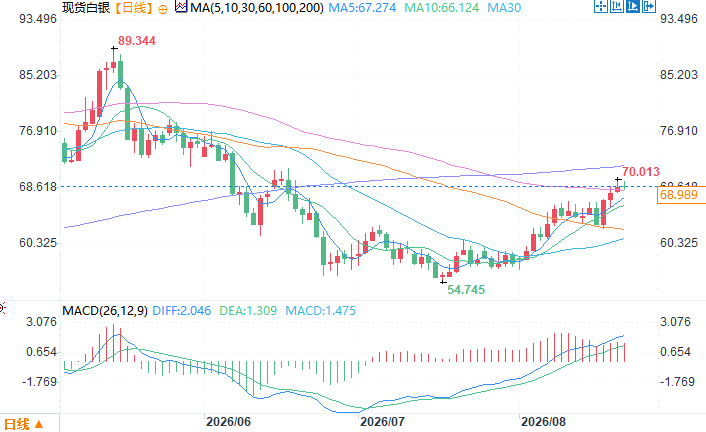 Spot silver daily chart source: FX678. At 13:25 Beijing time on August 24, spot silver was trading at $68.88 per ounce.
Breaking through key resistance, the silver carp leaps over the dragon gate.
Last week, silver achieved a crucial breakout, not only overcoming the resistance zone of $66.65 to $66.70 but also successfully breaking above the 38.2% Fibonacci retracement level of the decline from May to July this year. These two levels combined represent a double ceiling in the eyes of technical analysts; a break above this level often signifies a potential trend reversal. Even more reassuring for bulls is that on the 4-hour chart, silver prices are firmly above the 200-period simple moving average (SMA). This moving average can be considered the lifeline of the short-term trend; prices above it indicate that medium-term buying power is dominant, while a break below it could signal the end of the uptrend. Coupled with positive signals from oscillators, the short-term bullish trend for silver is essentially established. Chart: 4-hour chart of spot silver priceA Tale of Ice and Fire: MACD and RSI
However, there are also concerns amidst the optimism. First, let's look at the MACD (Moving Average Convergence Divergence). This indicator is currently still in positive territory, indicating that the upward momentum hasn't completely subsided and the upward trend remains intact. However, it's worth noting that the positive range of the MACD has narrowed. In layman's terms, the accelerator is still on, but the force is not as strong as before, suggesting a slowdown in the upward trend. Next, let's look at the RSI (Relative Strength Index), which is currently close to 66. This number indicates that market buying power is quite strong. Generally speaking, an RSI above 50 indicates that the bulls are in control, and approaching 70 indicates that the market is quite hot. However, the problem is that once the RSI enters the overbought zone above 70, it often indicates that the short-term gains have been excessive and the risk of a pullback has increased . In other words, silver is currently like a car traveling at high speed; the momentum is strong, but there may be a speed bump ahead.Upside Potential: From 72 to 89, a series of hurdles await breakthrough.
If silver can continue its upward trend, it will face a series of key resistance levels. The first hurdle is the 50% Fibonacci retracement level at $71.95; after breaking through, the next target is the 61.8% retracement level at $76.08, a level known in technical analysis as the golden ratio, often where the battle between bulls and bears is most intense. Further up, the 78.6% retracement level at $81.97 will be the next barrier, and the ultimate target is the high of this cycle at $89.47. From the current $69, there is still nearly 30% upside potential to the cycle high; of course, this requires silver prices to overcome these resistance levels.Downside defense line: $67 is the first line of defense.
Conversely, if the upward momentum falters and silver prices fall, there are multiple layers of support below. The first line of defense is the recently recovered 38.2% Fibonacci retracement level at $67.81, which has transformed from resistance to support and is a crucial level that the bulls must hold. If this level is broken, the next support is the 23.6% retracement level at $62.70, followed by the 200-period SMA at $60.93, which is also the last line of defense for the short-term trend. If even this level cannot be held, silver prices may further decline to the structural bottom around $54.43, which would mean almost entirely erasing the previous gains.Conclusion
Overall, silver's current technical outlook is clearly bullish. Last week's key breakout has opened up room for further gains, with the $70 mark within reach. However, the narrowing MACD momentum and the RSI approaching overbought territory remind investors not to blindly chase the price higher in the short term. $67.81 is a crucial support level that bulls must defend, while $71.95 is the next hurdle to overcome. At this critical juncture in the battle between bulls and bears, investors may want to patiently wait for a clearer direction before making any decisions. Spot silver daily chart source: FX678. At 13:25 Beijing time on August 24, spot silver was trading at $68.88 per ounce.
- Risk Warning and Disclaimer
- The market involves risk, and trading may not be suitable for all investors. This article is for reference only and does not constitute personal investment advice, nor does it take into account certain users’ specific investment objectives, financial situation, or other needs. Any investment decisions made based on this information are at your own risk.