The rise in gold prices is not simply due to safe-haven demand; a liquidity reassessment is underway.
2026-08-24 18:36:59
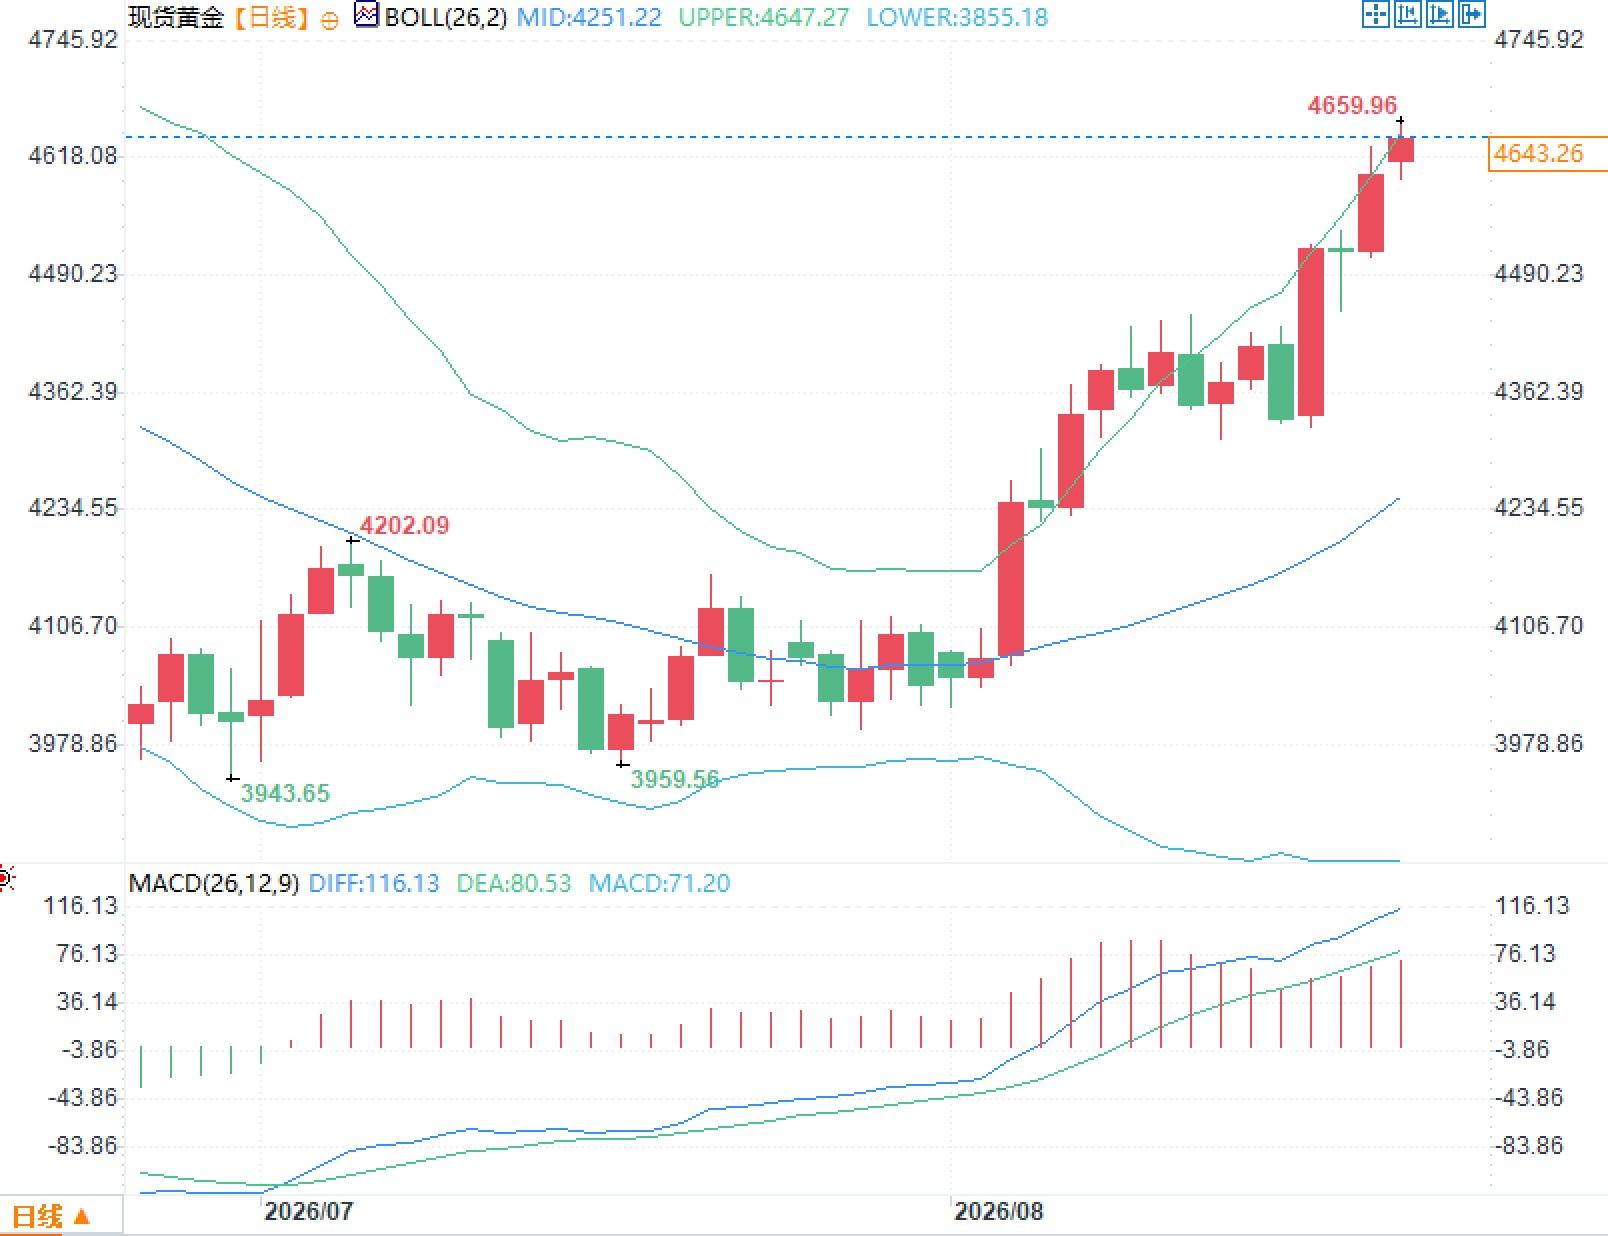
On Monday, August 24th, spot gold prices remained at relatively high levels amid recent fluctuations, briefly touching around $4659.96 per ounce, and are currently trading around $4645 per ounce. This movement is directly related to the US Treasury's announcement last week of expanding its long-term Treasury liquidity support repurchase operations. The US Treasury raised the single-transaction limit for 10- to 20-year and 20- to 30-year nominal bond repurchases, effective from September 9th until the end of this quarter's refinancing. US Treasury Secretary Bessant subsequently stated that the operation size could be further expanded depending on market conditions, and emphasized that current yield levels do not fully reflect fundamental factors. This measure has exerted short-term downward pressure on long-term nominal yields, while inflation expectations are rising faster than nominal yield changes, leading to a decline in real yields, which in turn supports the performance of assets such as gold that are sensitive to real interest rates. Market attention has now shifted to the Jackson Hole symposium, and Fed Chairman Warsh's speech may become a new source of volatility. 
Specific arrangements and immediate impact of the U.S. Treasury Department's expanded repurchase operations
On August 19, the U.S. Treasury announced that it would at least double the size of its liquidity support repurchase operations for longer-term nominal Treasury bonds. Covering both 10- to 20-year and 20- to 30-year maturities, the operations will take effect on September 9 and continue until the refinancing meeting on November 4. The Treasury stated that this move was intended to respond to continued strong market demand for long-term bonds, and that it frequently received a large number of high-quality offers during the operations. Following the announcement, yields on long-term U.S. Treasury bonds fell significantly, with the 30-year yield experiencing its largest single-day drop since October of last year, subsequently recovering some but remaining below previous highs. The 10-year yield fluctuated around 4.71%. While this type of operation is not formal quantitative easing, it objectively produces an effect similar to looser financial conditions by directly absorbing long-term supply and improving liquidity. Real yields further declined due to rising inflation expectations, providing fundamental support for gold.A Reassessment of Real Yield Changes and the Logic of Gold Pricing
Theoretically, long-term Treasury yields are composed of the average of short-term interest rate expectations plus a term premium, making them more sensitive to changes in the economic outlook. After the US Treasury expanded its repurchase operations, the nominal yield fell less than the inflation expectations rose, thus putting pressure on real yields. Market data shows that the 10-year breakeven inflation rate rose to a more than two-month high, reflecting a repricing of price stability. As a zero-interest asset, gold's opportunity cost and its negative correlation with real interest rates became apparent again during this period. Recent US non-farm payroll and consumer price index data have been relatively mild, easing some concerns about further tightening. Combined with the easing of financial conditions brought about by repurchase operations, this forms the fundamental background for the rise in gold prices. It should be noted that long-term yields are ultimately dominated by the path of monetary policy. The US Treasury's operations are more about liquidity adjustments at the debt management level than changing the policy interest rate itself. Therefore, the continued trajectory of real yields will depend on the interaction between subsequent inflation data and policy communication.The potential market weight of the Jackson Hole conference and Walsh's speech
The Jackson Hole Economic Policy Symposium will be a focal point, with Federal Reserve Chairman Warsh expected to deliver a keynote speech on August 28. Since taking office, Warsh has maintained a streamlined communication style, reducing forward guidance, emphasizing the priority of the inflation target, and repeatedly reiterating his commitment to bringing inflation back to 2%. He has publicly stated that inflation is primarily determined by monetary policy, and the Committee has clearly chosen to achieve price stability. The market previously anticipated a neutral tone in his speech, as recent employment and inflation data have eased tightening pressures. However, the Treasury's repurchase operations have further eased financial conditions. If Warsh addresses the impact of recent changes in conditions on the inflation reversion path or reiterates the willingness to respond appropriately if necessary, it could be interpreted by the market as a cautious approach to the easing environment. Conversely, if his speech does not directly address current financial conditions, it could reinforce existing expectations of easing. Regardless of the outcome, this communication will be a crucial juncture for testing the transparency of the policy response function.Technical structure of spot gold
From the daily chart, the Bollinger Bands for spot gold have the middle band at $4251.22/oz, the upper band at $4647.27/oz, and the lower band at $3855.18/oz. The price is trading above the middle band and approaching the upper band area. Regarding the MACD indicator, the DEA value is 80.53, and the MACD histogram is 71.20, both in positive territory. Recent candlestick patterns show a gradual rise from near the July lows, with increased volatility after mid-August. The Bollinger Bands have shown signs of widening after previous contraction, and the MACD histogram remains in positive territory.
- Risk Warning and Disclaimer
- The market involves risk, and trading may not be suitable for all investors. This article is for reference only and does not constitute personal investment advice, nor does it take into account certain users’ specific investment objectives, financial situation, or other needs. Any investment decisions made based on this information are at your own risk.