Expansioning demand coupled with tight global supply has pushed copper prices up, with LME copper nearing a record high of $14,500.
2026-08-26 14:49:00
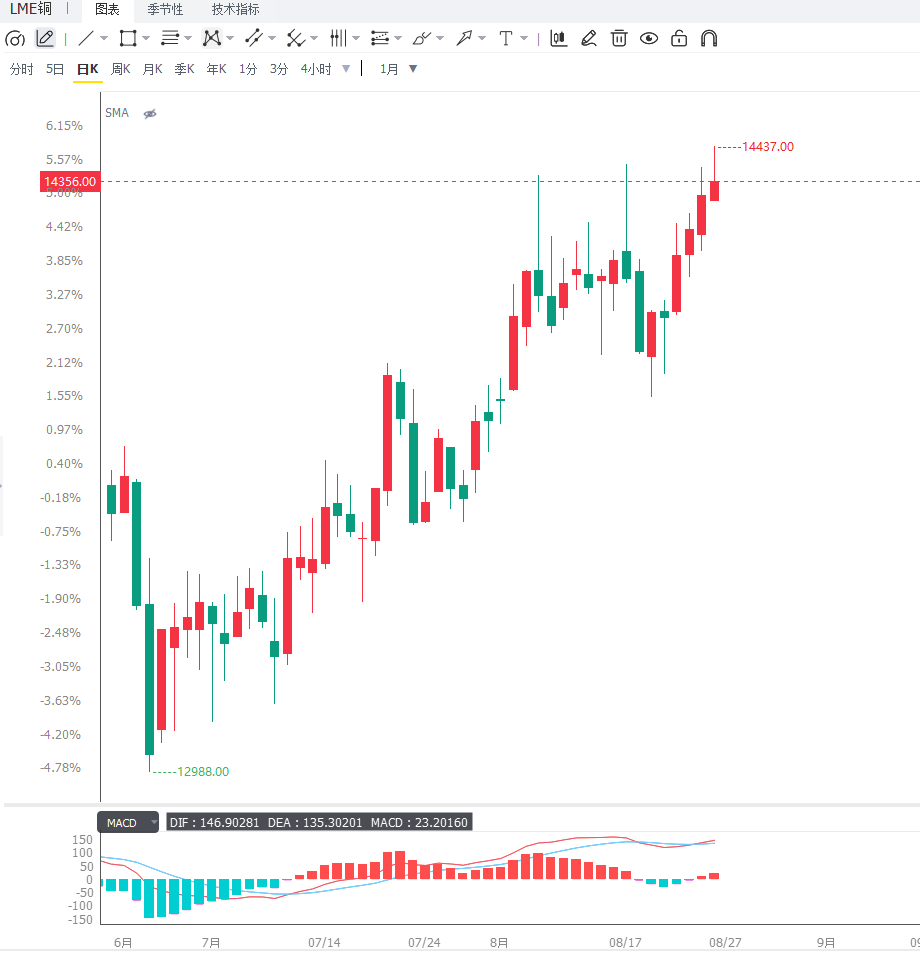
International copper prices continued their strong upward trend, with London Metal Exchange (LME) copper prices rising further on Wednesday after hitting a record closing high on Tuesday. The latest gain was approximately 0.5%, reaching around $14,415.50 per tonne, just shy of the intraday record high of $14,527.50 set in January. Year-to-date, LME copper prices have risen by about 16%, and the copper market is gradually evolving from a period of temporary supply tightness to a more pronounced structurally tight market.  The core of this price surge is not simply due to improved risk appetite in financial markets, but rather the supply pressure resulting from the reallocation of global copper spot resources. Recently, large quantities of copper have been shipped to the US market, further reducing available inventories outside the US. With limited new mining capacity globally and raw material supply constraints in the smelting sector, increased US demand effectively drains global spot resources, amplifying the tightness in other markets. The previously extremely widened spread between LME spot and three-month copper futures is the most direct market signal of this supply tightness. Last week, LME spot copper was more than $500 per ton higher than three-month copper, resulting in an unusually steep spot premium in the term structure, indicating that market participants were willing to pay higher prices for immediate deliverable copper resources. As the pressure of a short squeeze has eased, this spread has narrowed significantly recently. As of Tuesday's close, spot copper still had a premium of approximately $156 over three-month copper, far lower than the previous extreme level of over $500, but still relatively high compared to normal market conditions. The high spot premium means that the short-term supply pressure in the copper market has not truly disappeared. The United States is becoming a significant force in the global redistribution of copper resources. On the one hand, continued investment in US manufacturing, infrastructure, power grid construction, and artificial intelligence data centers is driving up copper demand. On the other hand, market expectations regarding future changes in US copper trade policy are prompting traders to adjust their global inventory layouts in advance. The impact of this inventory reallocation has a significant lag. Once copper is transferred from markets in Europe and Asia to the US, even if total global inventories do not immediately decrease, spot supply in other regions will decrease. For industrial metals markets that heavily rely on immediate inventory balance, regional shortages can also drive a rapid expansion of spot premiums. More importantly, copper mine supply is unlikely to respond quickly to price increases in the short term. Copper mine projects typically require a long period from exploration and approval to construction and production, while declining grades in older mines, insufficient capital expenditure, and production disruptions in some mining areas also limit the growth rate of global mine supply. Therefore, even though copper prices have risen to near historical highs, new supply cannot be released rapidly in the short term. From a demand structure perspective, investments related to artificial intelligence and new energy are becoming new long-term growth drivers for the copper market. Data centers require extensive power infrastructure; transmission networks, transformers, cables, and cooling systems all consume copper resources. Meanwhile, grid upgrades, electric transportation, and renewable energy projects also provide long-term demand support for copper. This means that the current copper price surge differs somewhat from traditional cyclical commodity market trends. Traditional industrial metals are typically highly dependent on real estate, manufacturing, and infrastructure cycles, while current copper demand is driven by energy transition, grid investment, and capital expenditure on artificial intelligence. More diversified demand growth sources provide strong fundamental support for the copper market even in a high-price environment. However, record prices are also accumulating new risks. Continuous copper price increases will raise raw material costs for downstream companies and may force some consumers to delay purchases, reduce inventory, or even seek alternative materials. If prices remain above $14,000 for an extended period, the suppressive effect of high prices on actual demand may gradually intensify. Furthermore, global economic growth remains a macroeconomic variable that copper prices must contend with. If manufacturing activity in major economies slows significantly, copper's industrial attributes may once again become a focus of market attention. At that time, even if supply remains tight, declining demand could drive a rapid contraction in spot premiums, putting significant downward pressure on copper prices. Inventory changes also warrant close monitoring. If the US continues to absorb overseas copper resources, and inventories in major trading centers such as the LME and Shanghai continue to decline, the tightness in the spot market may further increase, pushing copper prices above the intraday high of $14,527.50 reached in January. Once this historical high is effectively broken, technical buying could further amplify the upward movement. Conversely, if US import demand slows marginally, while global exchange inventories begin to recover and spot premiums continue to decline, it means that the strongest supply tightness factor is easing. At that time, copper prices may shift from a supply-driven market to a reassessment of actual consumption capacity. The market is currently at a critical juncture. $14,527.50 is not only a historical high but also a crucial technical level for determining whether the current rise is the start of a new trend or a squeeze from high-level supply. If a breakout is accompanied by positive spot market and inventory data, the upward trend in copper prices may extend further; if multiple attempts fail, the risk of profit-taking at high levels will increase significantly. From a daily chart perspective, LME copper maintains a clear bullish trend, with prices consistently trading above major medium-term moving averages, and both highs and lows rising, indicating generally strong market momentum. The current price is approaching the historical high of $14,527.50, which is the most significant short-term resistance level. A breakout with significant volume and a sustained hold above $14,527.50 on the daily chart would signify that copper is entering a historical price discovery phase, with a lack of significant historical resistance above, potentially allowing trend-following funds to further drive prices higher. On the downside, the first support level to watch is around $14,200, followed by the psychological level of $14,000. If a significant pullback occurs, the area around $13,700 becomes a more important trend support zone. As long as copper prices remain above $14,000, the medium-term bullish structure remains intact; however, a break below $13,700 warrants caution regarding profit-taking from the previous rapid rise. From a 4-hour chart perspective, copper prices maintain a high-level upward consolidation structure, but have clearly entered a very strong short-term zone. The current core resistance zone is between $14,400 and $14,527. If the price breaks through $14,527.50, it may open up further upside potential in the short term; if the price fails to break through, it may first retrace to $14,200 and then test $14,000.
  Editor's Summary: Copper prices continue to approach historical highs, reflecting the combined effects of global spot resource reallocation and insufficient supply growth. The US continues to absorb overseas copper resources, putting pressure on inventories in other regions, while mine supply is unlikely to increase rapidly in the short term, resulting in persistently high premiums in the spot market. Although the extreme spot premium of over $500 has narrowed significantly, the current spread of approximately $156 is still far above normal levels, indicating that the supply tightness in the copper market has not been completely resolved. If US demand remains strong and exchange inventories continue to decline, the probability of copper prices breaking through the historical high of $14,527.50 will further increase. However, investors also need to be wary of the demand-damaging effect of high prices themselves. Once global manufacturing demand weakens, or the pace of US inventory absorption slows, spot premiums may fall rapidly, and copper prices may shift from trading on supply tightness to trading on demand concerns. Therefore, whether copper prices can open up new upward space in the future depends not only on whether prices break through historical highs, but also on whether exchange inventories, US import demand, spot premiums, and global mine supply can simultaneously support this breakthrough. The short-term trend remains bullish, but the risk of volatility and pullback near historical highs is also increasing.
The core of this price surge is not simply due to improved risk appetite in financial markets, but rather the supply pressure resulting from the reallocation of global copper spot resources. Recently, large quantities of copper have been shipped to the US market, further reducing available inventories outside the US. With limited new mining capacity globally and raw material supply constraints in the smelting sector, increased US demand effectively drains global spot resources, amplifying the tightness in other markets. The previously extremely widened spread between LME spot and three-month copper futures is the most direct market signal of this supply tightness. Last week, LME spot copper was more than $500 per ton higher than three-month copper, resulting in an unusually steep spot premium in the term structure, indicating that market participants were willing to pay higher prices for immediate deliverable copper resources. As the pressure of a short squeeze has eased, this spread has narrowed significantly recently. As of Tuesday's close, spot copper still had a premium of approximately $156 over three-month copper, far lower than the previous extreme level of over $500, but still relatively high compared to normal market conditions. The high spot premium means that the short-term supply pressure in the copper market has not truly disappeared. The United States is becoming a significant force in the global redistribution of copper resources. On the one hand, continued investment in US manufacturing, infrastructure, power grid construction, and artificial intelligence data centers is driving up copper demand. On the other hand, market expectations regarding future changes in US copper trade policy are prompting traders to adjust their global inventory layouts in advance. The impact of this inventory reallocation has a significant lag. Once copper is transferred from markets in Europe and Asia to the US, even if total global inventories do not immediately decrease, spot supply in other regions will decrease. For industrial metals markets that heavily rely on immediate inventory balance, regional shortages can also drive a rapid expansion of spot premiums. More importantly, copper mine supply is unlikely to respond quickly to price increases in the short term. Copper mine projects typically require a long period from exploration and approval to construction and production, while declining grades in older mines, insufficient capital expenditure, and production disruptions in some mining areas also limit the growth rate of global mine supply. Therefore, even though copper prices have risen to near historical highs, new supply cannot be released rapidly in the short term. From a demand structure perspective, investments related to artificial intelligence and new energy are becoming new long-term growth drivers for the copper market. Data centers require extensive power infrastructure; transmission networks, transformers, cables, and cooling systems all consume copper resources. Meanwhile, grid upgrades, electric transportation, and renewable energy projects also provide long-term demand support for copper. This means that the current copper price surge differs somewhat from traditional cyclical commodity market trends. Traditional industrial metals are typically highly dependent on real estate, manufacturing, and infrastructure cycles, while current copper demand is driven by energy transition, grid investment, and capital expenditure on artificial intelligence. More diversified demand growth sources provide strong fundamental support for the copper market even in a high-price environment. However, record prices are also accumulating new risks. Continuous copper price increases will raise raw material costs for downstream companies and may force some consumers to delay purchases, reduce inventory, or even seek alternative materials. If prices remain above $14,000 for an extended period, the suppressive effect of high prices on actual demand may gradually intensify. Furthermore, global economic growth remains a macroeconomic variable that copper prices must contend with. If manufacturing activity in major economies slows significantly, copper's industrial attributes may once again become a focus of market attention. At that time, even if supply remains tight, declining demand could drive a rapid contraction in spot premiums, putting significant downward pressure on copper prices. Inventory changes also warrant close monitoring. If the US continues to absorb overseas copper resources, and inventories in major trading centers such as the LME and Shanghai continue to decline, the tightness in the spot market may further increase, pushing copper prices above the intraday high of $14,527.50 reached in January. Once this historical high is effectively broken, technical buying could further amplify the upward movement. Conversely, if US import demand slows marginally, while global exchange inventories begin to recover and spot premiums continue to decline, it means that the strongest supply tightness factor is easing. At that time, copper prices may shift from a supply-driven market to a reassessment of actual consumption capacity. The market is currently at a critical juncture. $14,527.50 is not only a historical high but also a crucial technical level for determining whether the current rise is the start of a new trend or a squeeze from high-level supply. If a breakout is accompanied by positive spot market and inventory data, the upward trend in copper prices may extend further; if multiple attempts fail, the risk of profit-taking at high levels will increase significantly. From a daily chart perspective, LME copper maintains a clear bullish trend, with prices consistently trading above major medium-term moving averages, and both highs and lows rising, indicating generally strong market momentum. The current price is approaching the historical high of $14,527.50, which is the most significant short-term resistance level. A breakout with significant volume and a sustained hold above $14,527.50 on the daily chart would signify that copper is entering a historical price discovery phase, with a lack of significant historical resistance above, potentially allowing trend-following funds to further drive prices higher. On the downside, the first support level to watch is around $14,200, followed by the psychological level of $14,000. If a significant pullback occurs, the area around $13,700 becomes a more important trend support zone. As long as copper prices remain above $14,000, the medium-term bullish structure remains intact; however, a break below $13,700 warrants caution regarding profit-taking from the previous rapid rise. From a 4-hour chart perspective, copper prices maintain a high-level upward consolidation structure, but have clearly entered a very strong short-term zone. The current core resistance zone is between $14,400 and $14,527. If the price breaks through $14,527.50, it may open up further upside potential in the short term; if the price fails to break through, it may first retrace to $14,200 and then test $14,000. Editor's Summary: Copper prices continue to approach historical highs, reflecting the combined effects of global spot resource reallocation and insufficient supply growth. The US continues to absorb overseas copper resources, putting pressure on inventories in other regions, while mine supply is unlikely to increase rapidly in the short term, resulting in persistently high premiums in the spot market. Although the extreme spot premium of over $500 has narrowed significantly, the current spread of approximately $156 is still far above normal levels, indicating that the supply tightness in the copper market has not been completely resolved. If US demand remains strong and exchange inventories continue to decline, the probability of copper prices breaking through the historical high of $14,527.50 will further increase. However, investors also need to be wary of the demand-damaging effect of high prices themselves. Once global manufacturing demand weakens, or the pace of US inventory absorption slows, spot premiums may fall rapidly, and copper prices may shift from trading on supply tightness to trading on demand concerns. Therefore, whether copper prices can open up new upward space in the future depends not only on whether prices break through historical highs, but also on whether exchange inventories, US import demand, spot premiums, and global mine supply can simultaneously support this breakthrough. The short-term trend remains bullish, but the risk of volatility and pullback near historical highs is also increasing.
- Risk Warning and Disclaimer
- The market involves risk, and trading may not be suitable for all investors. This article is for reference only and does not constitute personal investment advice, nor does it take into account certain users’ specific investment objectives, financial situation, or other needs. Any investment decisions made based on this information are at your own risk.