Gold has regained its long-term trend line; what signal does the inflow of 28 tons of funds send?
2026-08-26 15:27:00
On Wednesday, August 26th, spot gold entered a consolidation phase at high levels after a rapid and continuous rise, currently trading around $4640 per ounce, having recently touched a more than three-month high. The core market variable has shifted from a single safe-haven narrative to a complex pricing framework involving the combined effects of US fiscal financing costs, US Treasury term premiums, the Fed's inflation constraints, and precious metal fund flows. Meanwhile, the July US Personal Consumption Expenditures Price Index will be released today, and Fed Chairman Kevin Warsh will deliver a key speech at the Jackson Hole Economic Symposium this Friday, bringing macro pricing into a window of intensive data and policy communication. The most noteworthy aspect of gold's performance over the past week is not simply the price increase, but the change in its driving forces. Previously, the US Treasury expanded its long-term Treasury repurchase program, leading to a decline in long-term yields and a market reassessing the financing costs and maturity risks associated with its massive debt. Gold thus received two layers of support: firstly, the opportunity cost of non-interest-bearing assets decreased when real interest rates fell; secondly, as the market begins to re-examine the relationship between fiscal deficits, long-term debt supply, and currency purchasing power, the allocation value of gold as a non-sovereign credit asset will be re-priced. Spot gold recently rose to a more than three-month high of around $4,696 per ounce, but the latest trading session saw a pullback, indicating that the market has moved from a one-sided risk repricing phase to a high-level digestion phase.  The significance of this change lies in the fact that current gold prices can no longer be explained solely by short-term fluctuations in the US dollar. Even if the dollar index remains stable, gold may still experience independent price movements as long as there are significant changes in long-term interest rates, fiscal risk premiums, and real interest rate expectations. Conversely, when energy costs push up inflation expectations again, the likelihood of nominal interest rates remaining high will increase, thus constraining the valuation of non-interest-bearing precious metals. This week's macroeconomic focus is on the US July Personal Consumption Expenditures Price Index. The market generally expects the core indicator to still record an increase of about 0.2% month-on-month, with annual core inflation still significantly higher than the Fed's long-term target of 2%. Meanwhile, the Fed's policy rate is currently maintained in the 3.50% to 3.75% range, and the interest rate market prices a probability of maintaining the policy unchanged in September at about 61.6%. Boston Fed President Susan Collins recently stated that if future data does not prove that inflation continues to decline, interest rates may need to be adjusted further. This statement implies that the current focus of discussion within the Fed is not simply judging the strength of the economy, but whether the pace of inflation decline is sufficient to offset the risks of energy, import costs, and a resurgence of long-term inflation expectations. Currently, core personal consumption expenditure inflation is estimated at around 3.3%, still significantly below the 2% target. Therefore, the market value of the Jackson Hole speech lies primarily in its policy response function, rather than the wording itself. Kevin Warsh needs to explain how the Federal Reserve balances interest rates, its balance sheet, and financial conditions in an environment of high fiscal financing costs, increased volatility in long-term yields, and persistently sticky inflation. For gold, what truly affects valuation is the path of real interest rates and policy credibility, not whether a single meeting immediately changes policy. Looking at the daily chart, gold gradually rose from a low near 3959.56, breaking through the Bollinger Band's middle band and subsequently reaching the vicinity of the upper Bollinger Band. The Bollinger Band's middle band is approximately 4276.02, the upper band approximately 4688.87, and the lower band approximately 3863.18. After the price quickly moved away from the middle band, the Bollinger Bands expanded significantly, indicating a substantial increase in market volatility, rather than simply representing an indefinite trend.
 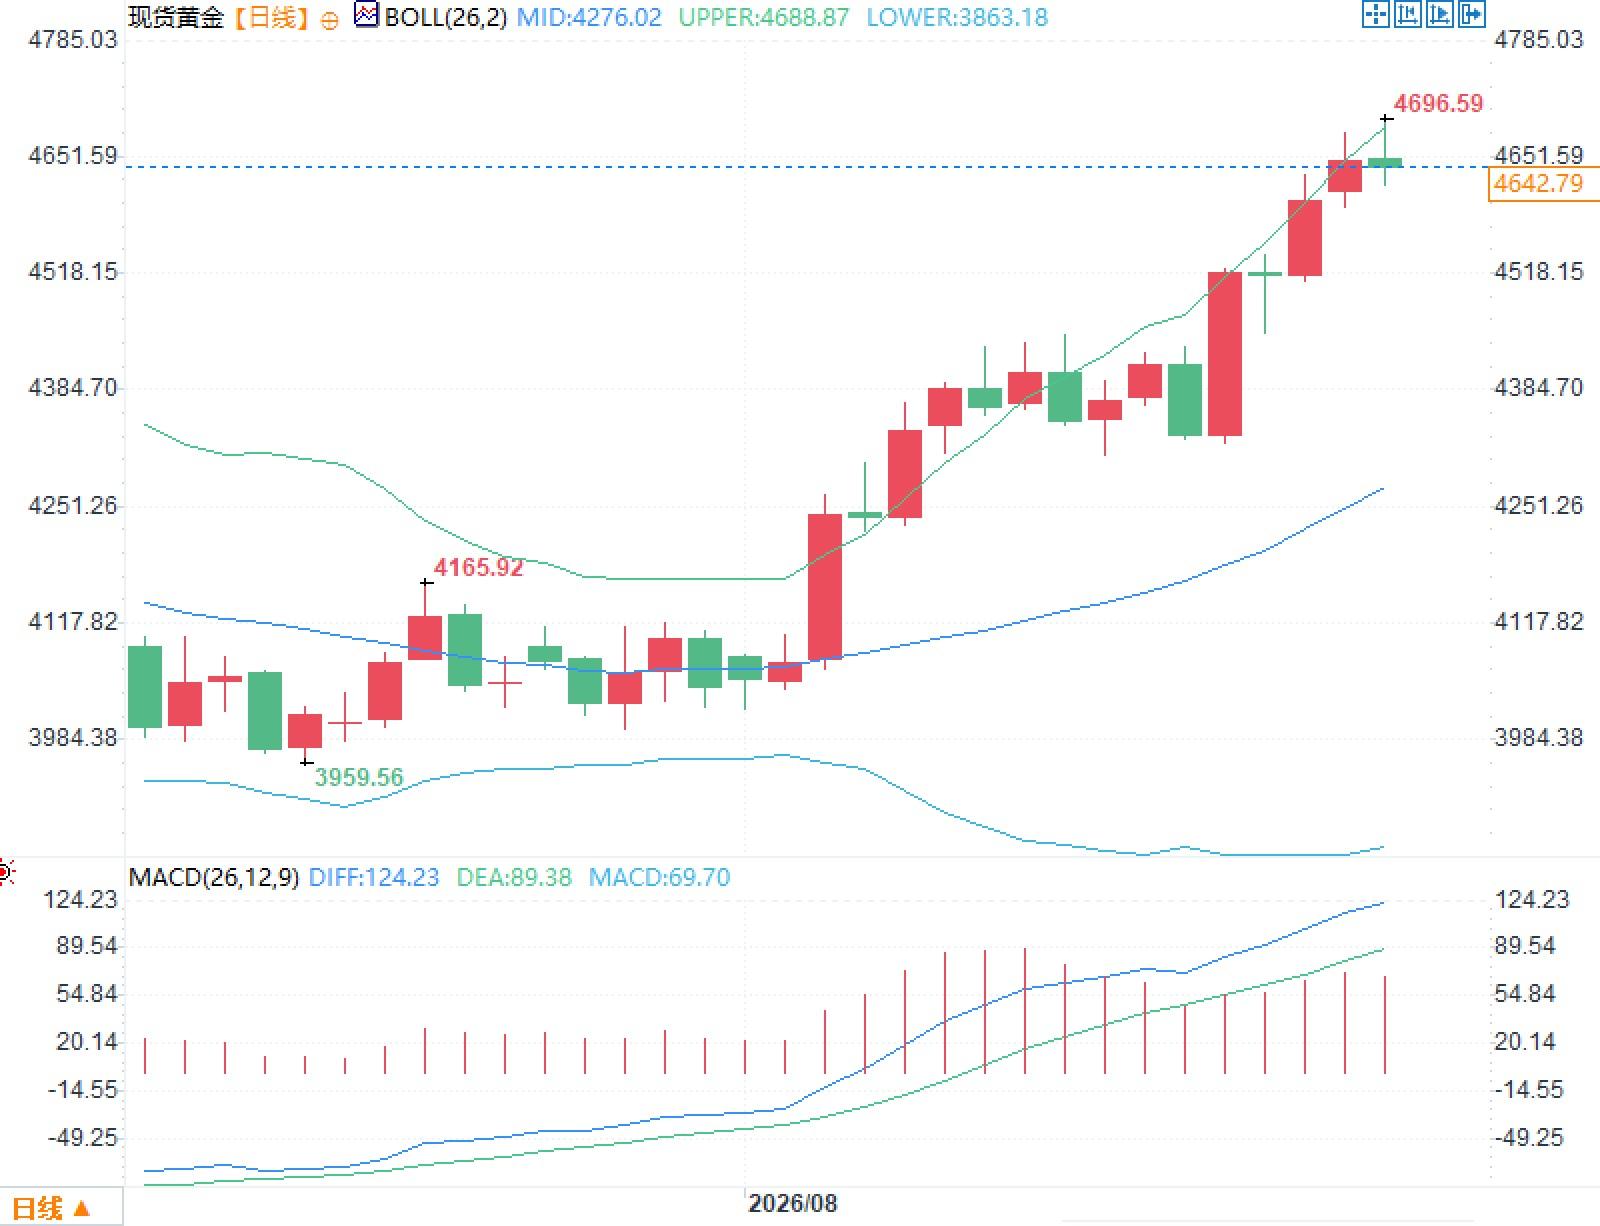 In terms of MACD, the DIFF line is around 124.23 and the DEA line is around 89.38, both above the zero line, with the histogram remaining positive, reflecting strong upward momentum in the previous upward movement. However, it can also be seen that after the price approached recent highs, the candlestick bodies shortened and the upper and lower shadows increased, indicating that the trading activity between buyers and sellers has shifted from trend-driven gains to high-level exchanges. The funding aspect is also worth noting. Gold-backed exchange-traded funds (ETFs) saw significant net inflows last week, with statistics showing an increase of over 28 tons in a single week, one of the largest increases since January. This re-entry of funds suggests that this round of price increases is not entirely driven by short-term buying, but also includes medium- to long-term asset allocation demand. On the other hand, with the rapid increase in fund inflows, market concentration may also rise, making subsequent prices significantly more sensitive to inflation data, yields, and Fed communications than before. Looking at cross-asset relationships, after expectations of easing tensions in the Middle East, oil prices fell, and the US Treasury yield curve declined by approximately 5 to 7 basis points, making gold simultaneously affected by both declining inflation expectations and changes in actual financing costs. The former reduces the demand for inflation hedging, while the latter reduces the opportunity cost of holding gold. This opposite effect is precisely the reason for the recent high-level fluctuations in gold prices.
The significance of this change lies in the fact that current gold prices can no longer be explained solely by short-term fluctuations in the US dollar. Even if the dollar index remains stable, gold may still experience independent price movements as long as there are significant changes in long-term interest rates, fiscal risk premiums, and real interest rate expectations. Conversely, when energy costs push up inflation expectations again, the likelihood of nominal interest rates remaining high will increase, thus constraining the valuation of non-interest-bearing precious metals. This week's macroeconomic focus is on the US July Personal Consumption Expenditures Price Index. The market generally expects the core indicator to still record an increase of about 0.2% month-on-month, with annual core inflation still significantly higher than the Fed's long-term target of 2%. Meanwhile, the Fed's policy rate is currently maintained in the 3.50% to 3.75% range, and the interest rate market prices a probability of maintaining the policy unchanged in September at about 61.6%. Boston Fed President Susan Collins recently stated that if future data does not prove that inflation continues to decline, interest rates may need to be adjusted further. This statement implies that the current focus of discussion within the Fed is not simply judging the strength of the economy, but whether the pace of inflation decline is sufficient to offset the risks of energy, import costs, and a resurgence of long-term inflation expectations. Currently, core personal consumption expenditure inflation is estimated at around 3.3%, still significantly below the 2% target. Therefore, the market value of the Jackson Hole speech lies primarily in its policy response function, rather than the wording itself. Kevin Warsh needs to explain how the Federal Reserve balances interest rates, its balance sheet, and financial conditions in an environment of high fiscal financing costs, increased volatility in long-term yields, and persistently sticky inflation. For gold, what truly affects valuation is the path of real interest rates and policy credibility, not whether a single meeting immediately changes policy. Looking at the daily chart, gold gradually rose from a low near 3959.56, breaking through the Bollinger Band's middle band and subsequently reaching the vicinity of the upper Bollinger Band. The Bollinger Band's middle band is approximately 4276.02, the upper band approximately 4688.87, and the lower band approximately 3863.18. After the price quickly moved away from the middle band, the Bollinger Bands expanded significantly, indicating a substantial increase in market volatility, rather than simply representing an indefinite trend. In terms of MACD, the DIFF line is around 124.23 and the DEA line is around 89.38, both above the zero line, with the histogram remaining positive, reflecting strong upward momentum in the previous upward movement. However, it can also be seen that after the price approached recent highs, the candlestick bodies shortened and the upper and lower shadows increased, indicating that the trading activity between buyers and sellers has shifted from trend-driven gains to high-level exchanges. The funding aspect is also worth noting. Gold-backed exchange-traded funds (ETFs) saw significant net inflows last week, with statistics showing an increase of over 28 tons in a single week, one of the largest increases since January. This re-entry of funds suggests that this round of price increases is not entirely driven by short-term buying, but also includes medium- to long-term asset allocation demand. On the other hand, with the rapid increase in fund inflows, market concentration may also rise, making subsequent prices significantly more sensitive to inflation data, yields, and Fed communications than before. Looking at cross-asset relationships, after expectations of easing tensions in the Middle East, oil prices fell, and the US Treasury yield curve declined by approximately 5 to 7 basis points, making gold simultaneously affected by both declining inflation expectations and changes in actual financing costs. The former reduces the demand for inflation hedging, while the latter reduces the opportunity cost of holding gold. This opposite effect is precisely the reason for the recent high-level fluctuations in gold prices.
- Risk Warning and Disclaimer
- The market involves risk, and trading may not be suitable for all investors. This article is for reference only and does not constitute personal investment advice, nor does it take into account certain users’ specific investment objectives, financial situation, or other needs. Any investment decisions made based on this information are at your own risk.