What suddenly changed the pricing logic for gold after Jackson Hole?
2026-08-31 16:01:02
On Monday, August 31, spot gold was trading around $4445 per ounce. Friday's rapid pullback was not due to a failure of the single safe-haven logic, but rather a market reassessment of the Federal Reserve's policy response function: inflation remained above target, short-term yields rose, and pricing in a September rate hike was clearly gaining momentum. Meanwhile, renewed tensions between the US and Iran pushed up energy prices, leaving gold facing two opposing forces: safe-haven demand and real interest rate pressures. 
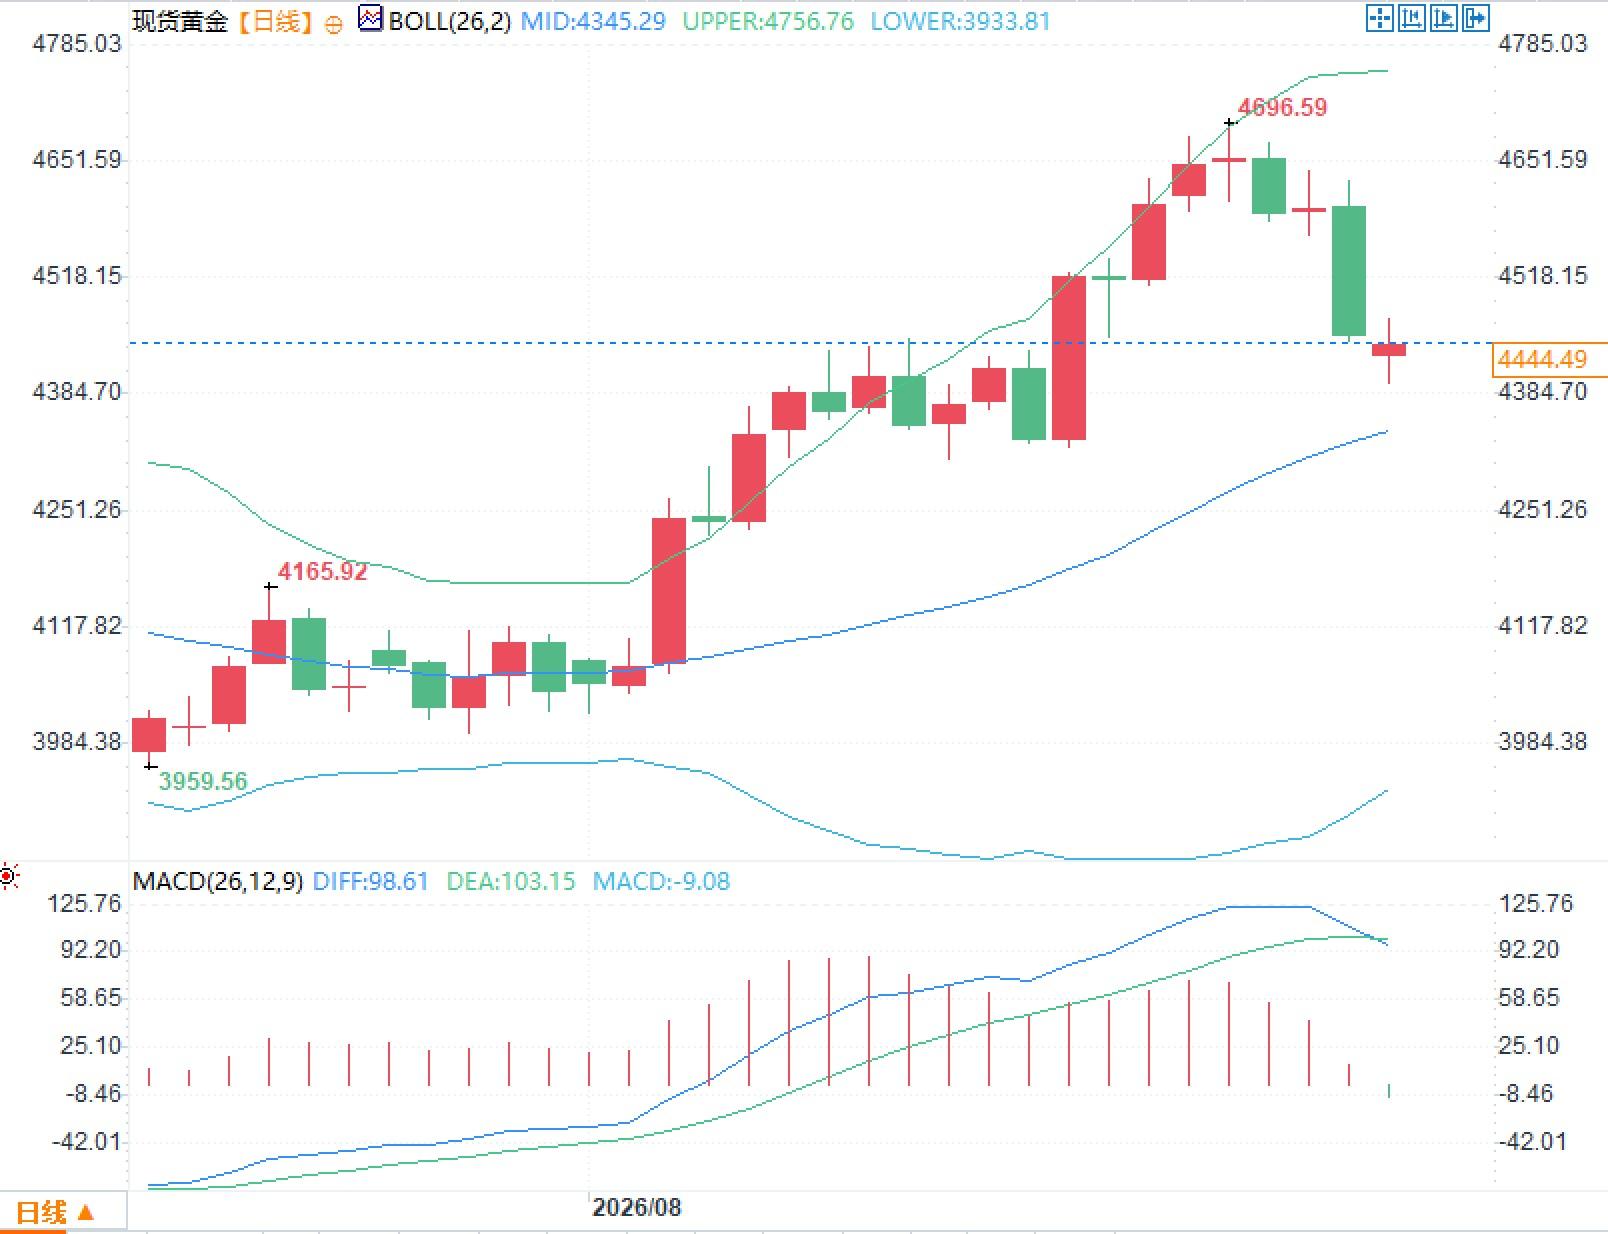 Regarding the MACD, the DIFF is 98.61, the DEA is 103.15, and the histogram has turned -9.08. The DIFF being lower than the DEA indicates a significant cooling of short-term momentum, but both lines remain above the zero axis, meaning that changes in short-term momentum are not synchronized with the positions of longer-term indicators. During periods when non-farm payrolls, inflation data, and policy meetings are closely approaching, the impact of macroeconomic events on indicators becomes significantly more pronounced.
I. After Jackson Hole: Gold pricing reverts to interest rates
In his speech on August 28, Federal Reserve Chairman Kevin Warsh emphasized that the 2% inflation target is clear and fixed, and stated that policymakers still have work to do if they cannot confirm that underlying inflation is returning to the target at a "clear and sufficiently fast" pace. More importantly, he stressed that his commitment was to discipline, not a specific decision; therefore, the speech itself did not directly promise a September rate hike. What truly changed the market was the raising of the policy threshold. The current target range for the federal funds rate remains 3.50% to 3.75%, and three members at the July meeting supported an increase of 25 basis points. After the speech, interest rate futures implied a September rate hike probability of approximately 57% to 60%, significantly higher than the pre-meeting level of approximately 36%. Here, it's necessary to distinguish between "market pricing" and "policy guidance": the former reflects investors' recalculation of conditional probabilities, while the latter remains data-dependent. For gold, this pricing is mainly transmitted through opportunity cost. Gold itself does not generate interest; when short-term yields and real yield expectations rise simultaneously, the relative holding cost of non-interest-bearing assets increases. Therefore, even if risk appetite declines, as long as interest rate repricing proceeds more quickly, safe-haven demand may not immediately translate into momentum for gold prices.II. Why didn't the oil price shock directly translate into a bullish effect on gold?
Following a renewed clash between the US and Iran over the weekend, Brent crude oil briefly returned to around $90 per barrel, while US benchmark crude rose above $85 per barrel, a daily increase of nearly 3%. Rising energy prices typically strengthen gold's inflation hedge properties, but the market is currently more focused on the second layer of transmission: whether oil prices will further increase inflation stickiness and force the Federal Reserve to maintain tighter financial conditions. Latest data shows that the US Personal Consumption Expenditures (PCE) price index rose 3.7% year-on-year in July, and the core index rose 3.3% year-on-year, both significantly higher than the 2% target. Warsh also pointed out that about 54% of the PCE basket items have increased by more than 3% over the past 12 months. This means that the risk of an energy shock is not only reflected in overall inflation but also in the speed of the decline in underlying inflation and the stability of inflation expectations. For gold, the safe-haven premium and inflation premium have not disappeared; they have simply been partially offset by expectations of higher policy interest rates at the current stage.Third, non-farm payrolls will test how far the "inflation-first" strategy can go.
The next key variable is the US August jobs report, to be released on September 4th. July non-farm payrolls fell by 23,000, with the unemployment rate at 4.1%. Meanwhile, the combined job gains for May and June were revised down by 103,000, indicating that hiring momentum has weakened significantly compared to the beginning of the year. Current market surveys primarily expect August job gains to be between 50,000 and 58,000, with the unemployment rate expected to remain around 4.1%. The importance of this report lies not in the quality of a single jobs figure, but in its potential to alter the risk weighting within the Federal Reserve. If employment continues to be weak, but wages and inflation remain sticky, the market will face a combination of weakening growth momentum and high inflation, making interest rate pricing more reliant on the risk balance between these two objectives. The next Fed policy meeting will be held on September 15th and 16th, and the August consumer price data will be released before the meeting. Therefore, gold is currently trading more as a probability distribution of policies than a predetermined policy outcome.IV. Daily Technical Structure: Momentum Cooling and Volatility Expansion Coexist
Observing the daily chart, the price previously rose rapidly to around 4696.59 before experiencing a significant pullback. It is currently still above the Bollinger Middle Band, but has broken away from the upper band area. The Bollinger Middle Band maintains an upward slope, while the gap between the upper and lower bands has widened compared to before. This combination primarily reflects increased volatility and a wider price distribution, and cannot be simply equated with a trend reversal. Regarding the MACD, the DIFF is 98.61, the DEA is 103.15, and the histogram has turned -9.08. The DIFF being lower than the DEA indicates a significant cooling of short-term momentum, but both lines remain above the zero axis, meaning that changes in short-term momentum are not synchronized with the positions of longer-term indicators. During periods when non-farm payrolls, inflation data, and policy meetings are closely approaching, the impact of macroeconomic events on indicators becomes significantly more pronounced.
- Risk Warning and Disclaimer
- The market involves risk, and trading may not be suitable for all investors. This article is for reference only and does not constitute personal investment advice, nor does it take into account certain users’ specific investment objectives, financial situation, or other needs. Any investment decisions made based on this information are at your own risk.