The successive attacks on two very large crude oil tankers have exposed the weakest link in the crude oil market.
2026-09-01 17:43:02
On Tuesday, September 1st, the crude oil market once again placed shipping safety in the Strait of Hormuz at the core of pricing, with Brent crude currently trading above $92 per barrel, up about 1.8% on the day. More important variables than simple production changes are the smooth passage of tankers through key waterways and whether insurance, chartering, and waiting costs continue to rise. 
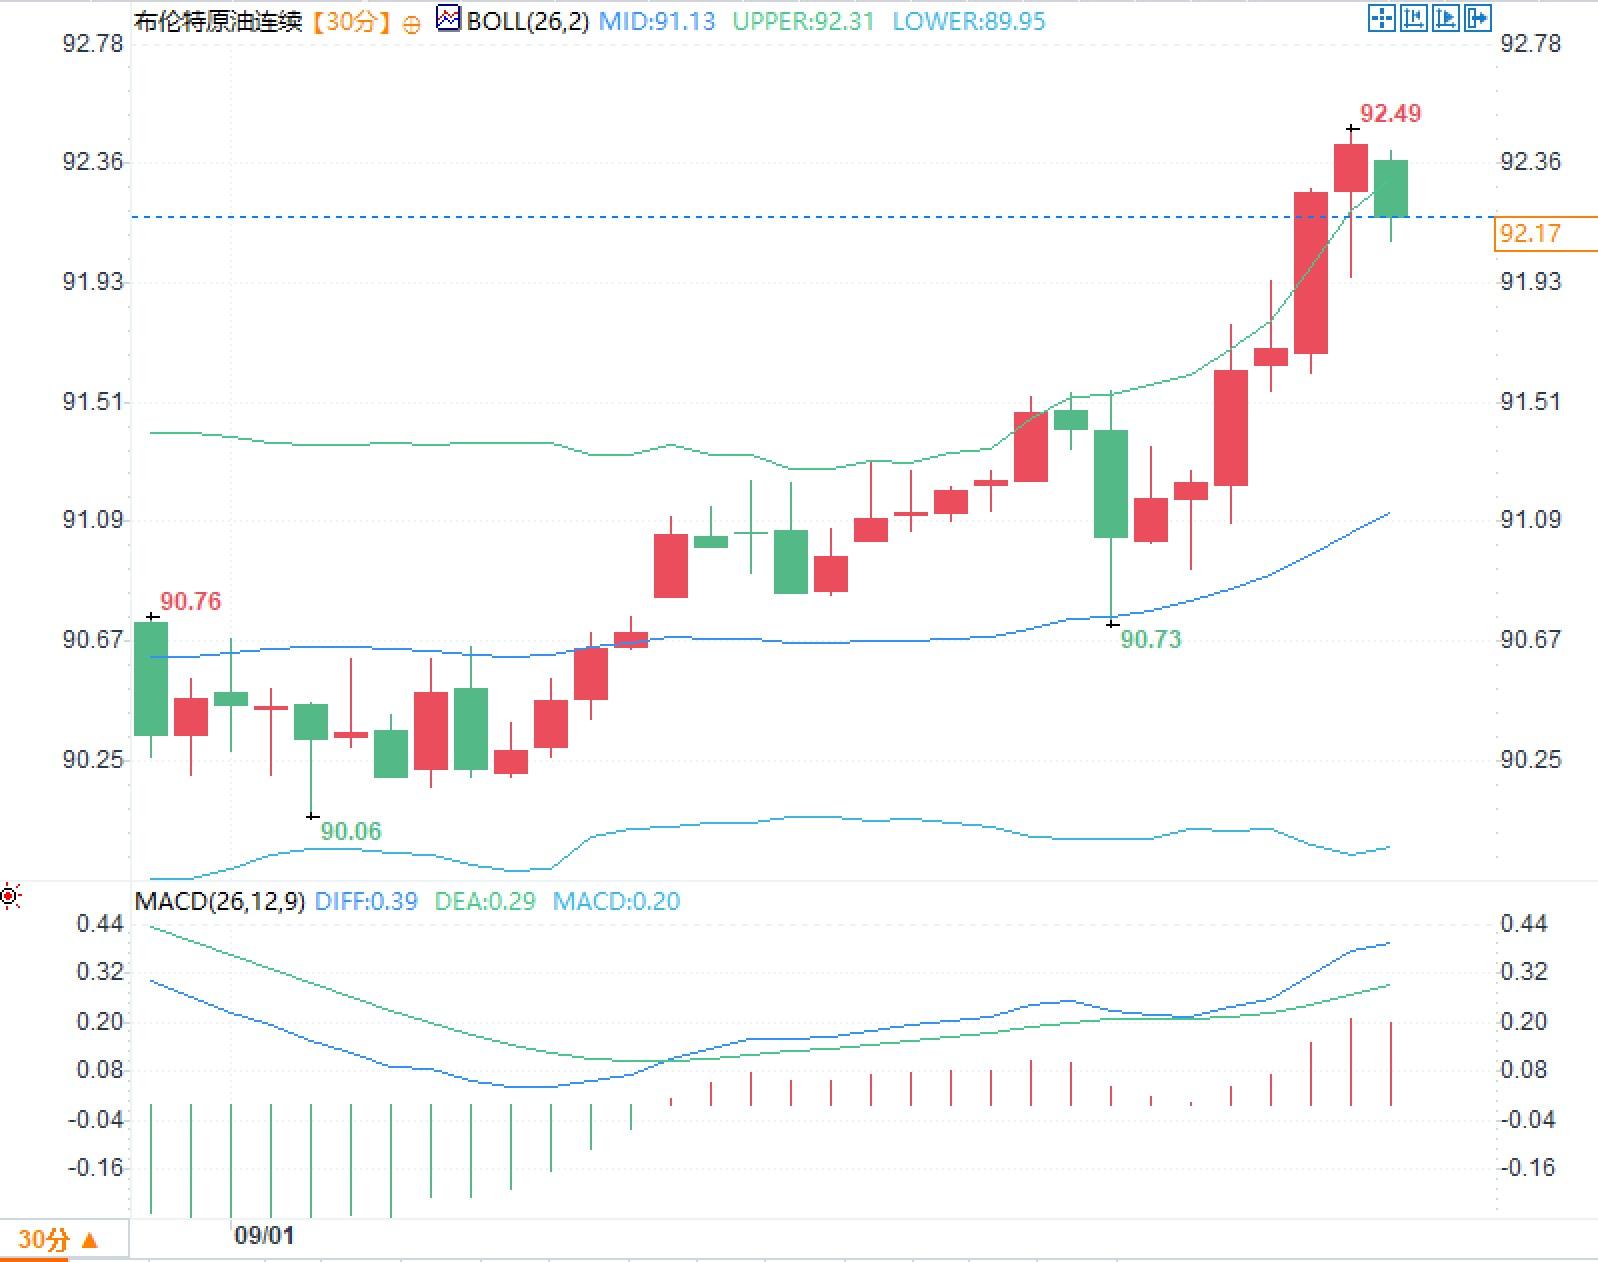 These signals are suitable for describing a "currently high-volatility, high-momentum market," but they cannot be used to conclude that this trend will inevitably continue, nor can a move near the upper Bollinger Band be mechanically interpreted as overbought. Both Bollinger Bands and MACD are price-derived indicators; more informative aspects are whether the indicators continue to align, whether volatility continues to expand, and whether prices have returned to their original trading range.
The attack on two very large crude carriers has prompted the market to reassess shipping availability.
Maritime safety information indicates that the Very Large Crude Carrier (VLCC) Sider was struck by an unidentified flying object (UFO) while sailing northeast of Saab in the Sea of Oman, and the Senegal Prosperity was struck three times while sailing outwards in the same area. Both ships were en route away from the Persian Gulf. Another maritime report confirms that a foreign oil tanker was struck by three unidentified objects. Disclosed information indicates no casualties or environmental impact, and the responsible party has not yet been independently confirmed. For crude oil pricing, the key is not just the damage to the hull, but whether the incident alters the risk parameters for shipowners, charterers, and insurers. Latest vessel tracking data shows that only five commodity vessels were visible passing through the Strait of Hormuz on Monday, significantly lower than the daily average of approximately 14 vessels over the previous 10 days, and no liquid bulk tankers passed through that day. Before the conflict, this waterway handled approximately 20% of global oil supply. Therefore, even without new production cuts at the oil field level, a decrease in available shipping capacity, transit frequency, and loading pace could lead to a repricing of spot premiums, freight rates, and time value.Thinning inventory buffers and weakening demand have not eliminated supply constraints.
The International Energy Agency's (IEA) August report presents a very typical structure: global oil demand is projected to decrease by 1.6 million barrels per day (bpd) in 2026, but while global supply increased by 2.4 million bpd to 101.5 million bpd in July, it is still 6.3 million bpd lower than the same period last year, with 8.3 million bpd of production in the Gulf region still shut down. Meanwhile, global observable oil inventories decreased by 69 million bpd in July, falling below 7.9 billion bpd; a cumulative decrease of 410 million bpd since the end of February. The agency also estimates that the global oil market deficit in the third quarter will be approximately 1.8 million bpd. This means that the current market cannot simply apply the static logic of "declining demand equals price pressure." Demand determines the strength of consumption, shipping constraints determine whether marginal barrels can reach the regions that need them, and inventories determine how long the market can withstand logistical frictions. The US Strategic Petroleum Reserve recently decreased by approximately 3.1 million bpd to 286.6 million bpd, the lowest level since 1982, also indicating that the readily available buffer is not ample. What we really need to observe is whether actual exports, shipping schedules, inventories, and refinery operating rates can improve in tandem, rather than simply looking at nominal production targets.The oil price shock is being transmitted to interest rates and inflation expectations.
The cross-asset characteristics of this round of volatility are intensifying. On September 1st, the yield on the US 10-year Treasury note rose to approximately 4.79%, and the yield on the UK 30-year government bond rose to approximately 5.88%. Rising energy prices will enter inflation expectations through transportation, chemical, aviation, and end-fuel costs, thereby affecting market pricing of the interest rate paths of major central banks. Rising long-term interest rates will in turn increase inventory financing, trade financing, and shipping capital costs, forming a feedback loop of "rising energy risk premiums, rising financing costs, and more expensive physical inventories." Therefore, Brent crude currently reflects not only geopolitical events themselves, but also the combined effects of the scarcity of deliverable crude oil, inventory safety cushions, freight rates, insurance, and the interest rate environment.Technical Structure Observation
Looking at the 30-minute chart, the price is above the Bollinger Middle Band and close to the Upper Band, with the Upper Band slope significantly rising and the bandwidth expanding compared to before. In the MACD, the DIFF line is above the DEA line, and the histogram remains positive. Meanwhile, the bodies and shadows of recent candlesticks have increased compared to the previous period, indicating that short-term price volatility and momentum are strengthening in tandem. These signals are suitable for describing a "currently high-volatility, high-momentum market," but they cannot be used to conclude that this trend will inevitably continue, nor can a move near the upper Bollinger Band be mechanically interpreted as overbought. Both Bollinger Bands and MACD are price-derived indicators; more informative aspects are whether the indicators continue to align, whether volatility continues to expand, and whether prices have returned to their original trading range.
- Risk Warning and Disclaimer
- The market involves risk, and trading may not be suitable for all investors. This article is for reference only and does not constitute personal investment advice, nor does it take into account certain users’ specific investment objectives, financial situation, or other needs. Any investment decisions made based on this information are at your own risk.