The current state of US debt is far worse than imagined.
2026-09-02 01:00:03
In my view, curbing the rise in long-term US Treasury yields is the sole core objective of current US policy. This is both the motivation behind the unexpected announcement from the US Treasury Department and an explanation for Kevin Warsh's shift in stance on inflation during his keynote speech at the Jackson Hole Economic Symposium. Previously, at the Fed meeting on July 29th, Warsh's dovish signals directly triggered a steepening of the yield curve, a scenario the US cannot afford to repeat. In my opinion, a new Treasury-Federal Reserve coordination mechanism is taking shape, its core objective being to stabilize long-term US Treasury yields against the backdrop of an already out-of-control US fiscal deficit. This view has been met with considerable resistance, therefore this article will explain that the underlying situation in the US Treasury market is more severe than it appears on the surface. Over the past month, US economic data has consistently fallen short of expectations; historically, such situations should have lowered long-term US Treasury yields. However, this has not been the case, reflecting the significant upward pressure on long-term US Treasury yields. Currently, all parties are working together to address this situation of rising long-term yields. 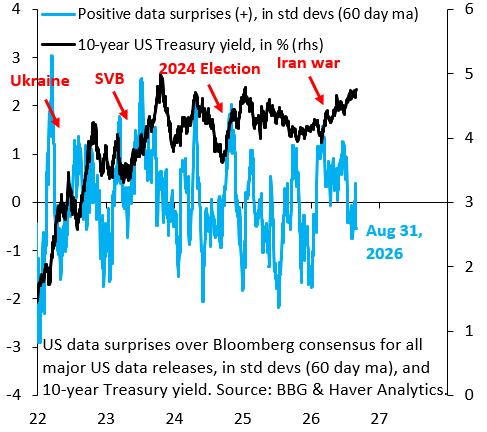 Chart: The blue line represents the weighted average of major US economic data relative to the Bloomberg consensus forecast, with weights set according to the importance of each data point to GDP growth predictions. This indicator has fallen sharply over the past month, remaining in negative territory, with an unexpected weighted average of approximately -0.5 standard deviations over the past 60 trading days. The drags included: weaker-than-expected July non-farm payroll data released on August 7 (deviation of -1.4 standard deviations); weaker-than-expected July retail sales data released on August 18 (deviation of -1.9 standard deviations); and a significantly lower-than-expected August Chicago Purchasing Managers Index released shortly before the Jackson Hole keynote address (deviation of -2.5 standard deviations). Weak economic data should have prompted the market to lower inflation and growth expectations, thereby suppressing the 10-year US Treasury yield; however, the opposite has occurred. Even with consistently disappointing data, the 10-year US Treasury yield has continued to rise. This indicates that market demand for US Treasuries is far weaker than it appears.
 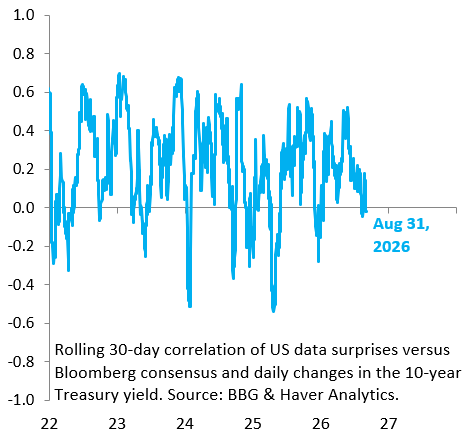 Chart: This chart shows the 30-day rolling correlation coefficient between unexpected economic data and daily changes in the 10-year US Treasury yield. This indicator fluctuates significantly, but its long-term average maintains a positive correlation level of around 0.3: that is, better-than-expected data leads to higher yields, and weaker-than-expected data leads to lower yields. The latest 30-day window data as of yesterday shows that the correlation coefficient has slightly turned negative. This indicates that yield movements have decoupled from economic data. The most reasonable explanation is that the market is now more focused on the development path of the fiscal deficit, thus pushing up long-term US Treasury yields regardless of economic data performance. The risks lurking behind the US Treasury market are far more worrying than people imagine.
Chart: The blue line represents the weighted average of major US economic data relative to the Bloomberg consensus forecast, with weights set according to the importance of each data point to GDP growth predictions. This indicator has fallen sharply over the past month, remaining in negative territory, with an unexpected weighted average of approximately -0.5 standard deviations over the past 60 trading days. The drags included: weaker-than-expected July non-farm payroll data released on August 7 (deviation of -1.4 standard deviations); weaker-than-expected July retail sales data released on August 18 (deviation of -1.9 standard deviations); and a significantly lower-than-expected August Chicago Purchasing Managers Index released shortly before the Jackson Hole keynote address (deviation of -2.5 standard deviations). Weak economic data should have prompted the market to lower inflation and growth expectations, thereby suppressing the 10-year US Treasury yield; however, the opposite has occurred. Even with consistently disappointing data, the 10-year US Treasury yield has continued to rise. This indicates that market demand for US Treasuries is far weaker than it appears. Chart: This chart shows the 30-day rolling correlation coefficient between unexpected economic data and daily changes in the 10-year US Treasury yield. This indicator fluctuates significantly, but its long-term average maintains a positive correlation level of around 0.3: that is, better-than-expected data leads to higher yields, and weaker-than-expected data leads to lower yields. The latest 30-day window data as of yesterday shows that the correlation coefficient has slightly turned negative. This indicates that yield movements have decoupled from economic data. The most reasonable explanation is that the market is now more focused on the development path of the fiscal deficit, thus pushing up long-term US Treasury yields regardless of economic data performance. The risks lurking behind the US Treasury market are far more worrying than people imagine.
- Risk Warning and Disclaimer
- The market involves risk, and trading may not be suitable for all investors. This article is for reference only and does not constitute personal investment advice, nor does it take into account certain users’ specific investment objectives, financial situation, or other needs. Any investment decisions made based on this information are at your own risk.