Crude oil trading alert: Declining EIA inventory data coupled with heightened geopolitical tensions are supporting oil prices, which are currently fluctuating at high levels, awaiting a breakout.
2026-09-03 10:08:03
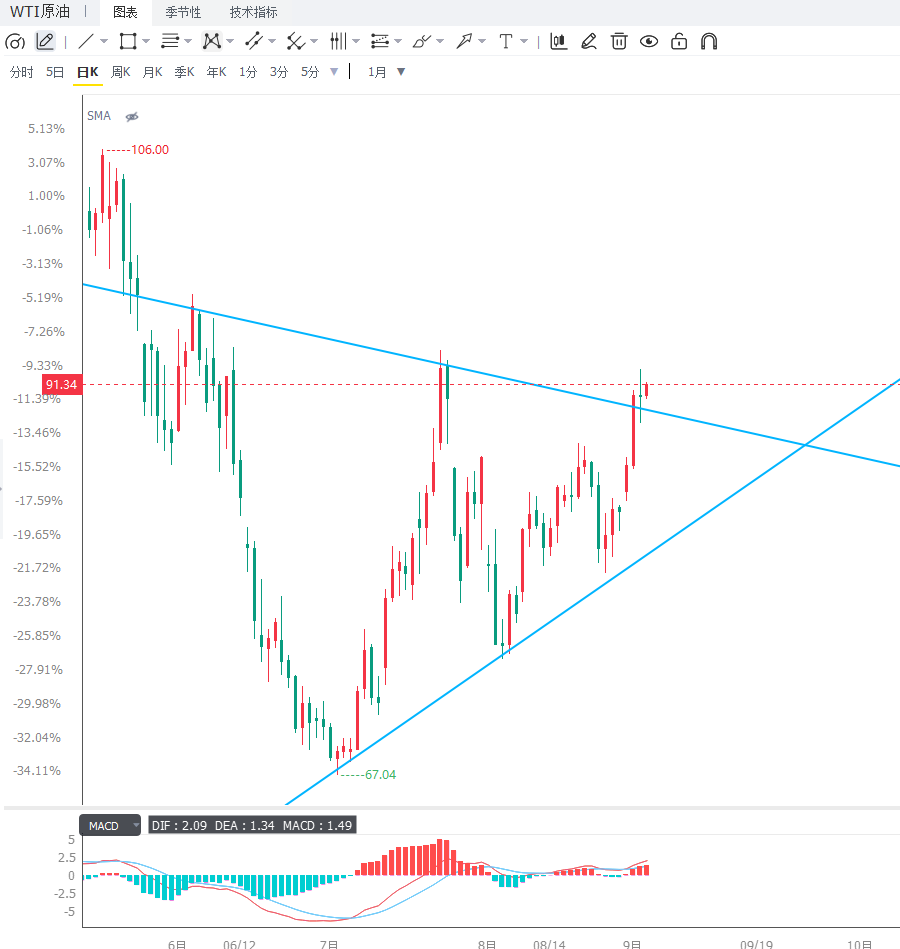
After three consecutive days of rapid gains, the crude oil market began to show clear signs of consolidation at high levels on Wednesday. Previously, the market was primarily repricing around Middle East energy supply risks, with WTI crude oil prices briefly moving above $90, accumulating a gain of approximately 9%. As of the latest trading session, WTI remained around $91, while Brent crude hovered below the $96 mark. The lack of a further significant upward surge in oil prices reflects investors rebalancing the forces of escalating geopolitical risks versus the possibility of de-escalation.  US President Trump stated that the new round of military action would not "last long," while emphasizing that relevant forces had already taken action against radar, missile, and facilities along the Strait of Hormuz in Iran, and indicated that they still possess the capability to launch another strike. The market's interpretation of this is complex: on the one hand, the statement implies that the risks to Middle Eastern energy infrastructure and transportation routes have not been eliminated; on the other hand, the assessment of the duration of the action has reduced some market concerns about prolonged supply disruptions. The Strait of Hormuz remains a core variable in oil market risk pricing. Under normal circumstances, this waterway handles nearly one-fifth of global oil transportation, so any sustained disruption could quickly impact crude oil and refined product supplies in Asia, Europe, and other regions. Latest shipping data shows that the number of commodity vessels passing through the Strait of Hormuz on September 1st was significantly lower than the recent average, indicating that shipping activity remains affected by the situation. However, the market is not currently pricing in entirely according to the extreme scenario of a "prolonged supply disruption." Trump's statement that the action would not last long, and the market's expectation that all parties involved would seek de-escalation, have begun to suppress some of the previously rapidly established risk premiums. For crude oil, this means that future price movements may no longer solely depend on conflict news itself, but rather on actual shipping volumes, port and refinery operations, and whether the Strait of Hormuz can maintain relatively stable energy transport. On the fundamental side, the latest EIA data provided strong support for oil prices. Data showed that in the week ending August 28, U.S. commercial crude oil inventories decreased by approximately 4.5 million barrels to 424.5 million barrels, a much larger drop than the market's previous expectation of about 300,000 barrels, and the first such significant inventory decline since the end of July. Refinery utilization rates rose to 98%, the highest level since August 2018, with refinery crude oil processing increasing by approximately 103,000 barrels per day; meanwhile, U.S. crude oil exports increased by approximately 691,000 barrels per day to 4.5 million barrels per day. The decline in U.S. domestic crude oil inventories does not entirely indicate a sudden surge in end-user demand, but is related to both high refinery operating levels and increased exports. Therefore, while the inventory decline has intensified market tensions, investors still need to distinguish between a genuine tightening of supply and inventory being affected by high turnover. From a longer-term perspective, U.S. commercial crude oil inventories remain slightly above the five-year seasonal average, indicating that inventory levels have not yet reached an extreme tightness. Cushing inventories increased slightly by about 80,000 barrels to 22.5 million barrels, showing that there is no significant supply squeeze in the U.S. inland delivery center for the time being. Meanwhile, gasoline inventories fell by about 1.2 million barrels to 205.7 million barrels, about 6% below the five-year seasonal average, meaning that the tightness in the refined product market remains a concern. Distillate fuel inventories increased by about 800,000 barrels, but inventories on the U.S. East Coast are already at extremely low levels. Structurally, this round of energy price increases is not solely driven by crude oil; supply pressures from refined products such as diesel are also playing a role. The risk premium in the distillate fuel market has increased significantly after the Middle East situation disrupted refinery operations, refined product transportation, and regional supply chains. For aviation, transportation, and industrial companies, continued increases in refined product prices could further push up energy costs and transmit to inflation expectations. If this trend continues, market judgments on global economic growth and the monetary policy paths of major central banks may also be affected. It's worth noting that the latest EIA data also shows that US crude oil production increased by approximately 19,000 barrels per day to 13.86 million barrels per day, while refinery utilization reached 98%. This means that the US still possesses strong supply and processing capabilities, which can, to some extent, buffer the impact of tight international market supply. Therefore, current oil prices are actually in a phase where "geopolitical risk premium" and "actual supply and demand fundamentals" work together. As long as there is no sustained large-scale disruption to shipping in the Strait of Hormuz, further increases in oil prices will require new fundamental catalysts; conversely, if shipping disruptions expand, key energy facilities are damaged, or actual exports decline significantly, the market may quickly repric the supply risk, pushing WTI to retest $95 or even higher. From a global market perspective, the impact of high oil prices on inflation expectations and risk assets is also increasing. The combined effects of declining US gasoline inventories, tight diesel supply, and crude oil transportation risks may keep energy prices highly volatile in the short term. At the same time, the US dollar is receiving some support due to increased safe-haven demand, which will also put some pressure on dollar-denominated crude oil. Therefore, whether oil prices can break through previous highs depends on a combination of factors, including the dollar's performance, US inventories, refinery utilization rates, and actual supply changes in the Middle East, rather than relying on a single event. From a daily chart perspective, WTI rebounded after a rapid decline and accelerated upwards after breaking through a triangle consolidation zone recently, shifting the short-term trend from a weak, oscillating pattern to a clear rebound. However, after the price surged above $91, the area around $95 has become a significant resistance zone, with selling pressure near previous highs limiting further gains. While the current moving average structure is gradually improving and short-term market momentum remains bullish, the widening divergence after consecutive gains also increases the risk of chasing the rally. If oil prices can effectively hold above $91 and further break through $95, the upside potential may reopen; conversely, if resistance persists around $95, prices may first retrace to the $89-$87 area. $87 is a key support level to watch on the daily chart; a break below this level would mean the current rapid rebound may revert to range-bound trading. From a 4-hour chart perspective, WTI is still in a consolidation phase after its recent rise, with prices fluctuating around short-term moving averages. While bullish momentum hasn't been completely destroyed, it has cooled significantly compared to the previous few trading days. Momentum indicators such as the MACD are still in bullish territory, but they show signs of overbought conditions after the rapid rise, meaning further upward movement requires new fundamental catalysts. If the 4-hour chart shows a breakout above the $93-$95 resistance zone with renewed volume, the short-term trend may continue and test higher levels. However, if repeated attempts to break through fail, profit-taking should be anticipated, with the first pullback target around $89, followed by support at $87. Overall, the current focus is on whether $95 can be broken and whether $87 can hold.
  Editor's Summary: Current oil price increases are supported by both geopolitical risks and declining inventories, but market expectations of easing tensions are limiting further expansion of the risk premium. A 4.5 million barrel decrease in EIA inventories, a refinery utilization rate rising to 98%, and increased US exports provide real fundamental support for oil prices. Meanwhile, traffic in the Strait of Hormuz remains below recent averages, meaning supply risks have not completely subsided. In the short term, WTI faces strong resistance around $95, and without new supply-side shocks, the probability of a technical correction after continuous gains is increasing. Investors should focus on the effectiveness of a breakout above $95, the strength of support at $87, and actual traffic changes in the Strait of Hormuz; these three factors will jointly determine whether oil prices expand further upwards or return to range-bound trading.
US President Trump stated that the new round of military action would not "last long," while emphasizing that relevant forces had already taken action against radar, missile, and facilities along the Strait of Hormuz in Iran, and indicated that they still possess the capability to launch another strike. The market's interpretation of this is complex: on the one hand, the statement implies that the risks to Middle Eastern energy infrastructure and transportation routes have not been eliminated; on the other hand, the assessment of the duration of the action has reduced some market concerns about prolonged supply disruptions. The Strait of Hormuz remains a core variable in oil market risk pricing. Under normal circumstances, this waterway handles nearly one-fifth of global oil transportation, so any sustained disruption could quickly impact crude oil and refined product supplies in Asia, Europe, and other regions. Latest shipping data shows that the number of commodity vessels passing through the Strait of Hormuz on September 1st was significantly lower than the recent average, indicating that shipping activity remains affected by the situation. However, the market is not currently pricing in entirely according to the extreme scenario of a "prolonged supply disruption." Trump's statement that the action would not last long, and the market's expectation that all parties involved would seek de-escalation, have begun to suppress some of the previously rapidly established risk premiums. For crude oil, this means that future price movements may no longer solely depend on conflict news itself, but rather on actual shipping volumes, port and refinery operations, and whether the Strait of Hormuz can maintain relatively stable energy transport. On the fundamental side, the latest EIA data provided strong support for oil prices. Data showed that in the week ending August 28, U.S. commercial crude oil inventories decreased by approximately 4.5 million barrels to 424.5 million barrels, a much larger drop than the market's previous expectation of about 300,000 barrels, and the first such significant inventory decline since the end of July. Refinery utilization rates rose to 98%, the highest level since August 2018, with refinery crude oil processing increasing by approximately 103,000 barrels per day; meanwhile, U.S. crude oil exports increased by approximately 691,000 barrels per day to 4.5 million barrels per day. The decline in U.S. domestic crude oil inventories does not entirely indicate a sudden surge in end-user demand, but is related to both high refinery operating levels and increased exports. Therefore, while the inventory decline has intensified market tensions, investors still need to distinguish between a genuine tightening of supply and inventory being affected by high turnover. From a longer-term perspective, U.S. commercial crude oil inventories remain slightly above the five-year seasonal average, indicating that inventory levels have not yet reached an extreme tightness. Cushing inventories increased slightly by about 80,000 barrels to 22.5 million barrels, showing that there is no significant supply squeeze in the U.S. inland delivery center for the time being. Meanwhile, gasoline inventories fell by about 1.2 million barrels to 205.7 million barrels, about 6% below the five-year seasonal average, meaning that the tightness in the refined product market remains a concern. Distillate fuel inventories increased by about 800,000 barrels, but inventories on the U.S. East Coast are already at extremely low levels. Structurally, this round of energy price increases is not solely driven by crude oil; supply pressures from refined products such as diesel are also playing a role. The risk premium in the distillate fuel market has increased significantly after the Middle East situation disrupted refinery operations, refined product transportation, and regional supply chains. For aviation, transportation, and industrial companies, continued increases in refined product prices could further push up energy costs and transmit to inflation expectations. If this trend continues, market judgments on global economic growth and the monetary policy paths of major central banks may also be affected. It's worth noting that the latest EIA data also shows that US crude oil production increased by approximately 19,000 barrels per day to 13.86 million barrels per day, while refinery utilization reached 98%. This means that the US still possesses strong supply and processing capabilities, which can, to some extent, buffer the impact of tight international market supply. Therefore, current oil prices are actually in a phase where "geopolitical risk premium" and "actual supply and demand fundamentals" work together. As long as there is no sustained large-scale disruption to shipping in the Strait of Hormuz, further increases in oil prices will require new fundamental catalysts; conversely, if shipping disruptions expand, key energy facilities are damaged, or actual exports decline significantly, the market may quickly repric the supply risk, pushing WTI to retest $95 or even higher. From a global market perspective, the impact of high oil prices on inflation expectations and risk assets is also increasing. The combined effects of declining US gasoline inventories, tight diesel supply, and crude oil transportation risks may keep energy prices highly volatile in the short term. At the same time, the US dollar is receiving some support due to increased safe-haven demand, which will also put some pressure on dollar-denominated crude oil. Therefore, whether oil prices can break through previous highs depends on a combination of factors, including the dollar's performance, US inventories, refinery utilization rates, and actual supply changes in the Middle East, rather than relying on a single event. From a daily chart perspective, WTI rebounded after a rapid decline and accelerated upwards after breaking through a triangle consolidation zone recently, shifting the short-term trend from a weak, oscillating pattern to a clear rebound. However, after the price surged above $91, the area around $95 has become a significant resistance zone, with selling pressure near previous highs limiting further gains. While the current moving average structure is gradually improving and short-term market momentum remains bullish, the widening divergence after consecutive gains also increases the risk of chasing the rally. If oil prices can effectively hold above $91 and further break through $95, the upside potential may reopen; conversely, if resistance persists around $95, prices may first retrace to the $89-$87 area. $87 is a key support level to watch on the daily chart; a break below this level would mean the current rapid rebound may revert to range-bound trading. From a 4-hour chart perspective, WTI is still in a consolidation phase after its recent rise, with prices fluctuating around short-term moving averages. While bullish momentum hasn't been completely destroyed, it has cooled significantly compared to the previous few trading days. Momentum indicators such as the MACD are still in bullish territory, but they show signs of overbought conditions after the rapid rise, meaning further upward movement requires new fundamental catalysts. If the 4-hour chart shows a breakout above the $93-$95 resistance zone with renewed volume, the short-term trend may continue and test higher levels. However, if repeated attempts to break through fail, profit-taking should be anticipated, with the first pullback target around $89, followed by support at $87. Overall, the current focus is on whether $95 can be broken and whether $87 can hold. Editor's Summary: Current oil price increases are supported by both geopolitical risks and declining inventories, but market expectations of easing tensions are limiting further expansion of the risk premium. A 4.5 million barrel decrease in EIA inventories, a refinery utilization rate rising to 98%, and increased US exports provide real fundamental support for oil prices. Meanwhile, traffic in the Strait of Hormuz remains below recent averages, meaning supply risks have not completely subsided. In the short term, WTI faces strong resistance around $95, and without new supply-side shocks, the probability of a technical correction after continuous gains is increasing. Investors should focus on the effectiveness of a breakout above $95, the strength of support at $87, and actual traffic changes in the Strait of Hormuz; these three factors will jointly determine whether oil prices expand further upwards or return to range-bound trading.
- Risk Warning and Disclaimer
- The market involves risk, and trading may not be suitable for all investors. This article is for reference only and does not constitute personal investment advice, nor does it take into account certain users’ specific investment objectives, financial situation, or other needs. Any investment decisions made based on this information are at your own risk.