As expectations of a Fed rate hike rise, the dollar index continues to fluctuate, awaiting guidance from CPI data.
2026-09-07 14:36:07
The US dollar index remained range-bound in early Asian trading on Monday, hovering around 99. With US markets closed for Labor Day, overall liquidity was relatively limited, and the dollar's short-term movements were largely driven by strong employment data and changes in Federal Reserve interest rate expectations. Data released by the US Bureau of Labor Statistics showed that US non-farm payrolls increased by 162,000 in August, significantly higher than the market expectation of 56,000 , while the previous figure was revised upward to an increase of 21,000. The unemployment rate remained at 4.1%, indicating that while the US job market has cooled significantly compared to before, it still retains some resilience. Following the significantly better-than-expected employment data, the market quickly adjusted its assessment of the Federal Reserve's policy.  According to the CME FedWatch tool, traders currently expect a 58.3% probability of a Fed rate hike in September, a significant increase from before the release of strong employment data. The resilience of the labor market means the Fed has more room to maintain a tighter policy stance given that inflationary pressures have not yet fully subsided, thus providing short-term support for the dollar and US Treasury yields. However, whether the dollar can further open up upward space still depends on the US inflation data to be released this week. The Producer Price Index (PPI) and Consumer Price Index (CPI) will be the focus of the market. If PPI and CPI continue to perform strongly, it may further strengthen expectations of a September rate hike and push the dollar to retest the 100 level; conversely, if inflation cools significantly, the market may re-bet on the Fed keeping interest rates unchanged, and the dollar's previous gains may face downward pressure. Market strategists believe that strong CPI data could significantly increase the certainty of a September rate hike and further support the dollar; if inflation data is lower than expected, it may weaken rate hike expectations, putting the dollar under renewed pressure to repric a dovish policy stance. From the perspective of interest rate market transmission, recent employment data has already pushed up US Treasury yields and improved the dollar's short-term performance. Strong employment means that the US economy is temporarily more resilient to pressure, and it has also cooled market expectations for a rapid shift to easing. Therefore, the US dollar still has some fundamental support before the release of US inflation data this week. However, it should be noted that the US dollar has not yet formed a clear medium-term upward trend. If subsequent inflation data is insufficient to support the continued rise in interest rate expectations, the US dollar index may fall back to the vicinity of the key moving average. Therefore, the short-term strength of the US dollar is more reflected in the repair of interest rate expectations, rather than the complete establishment of a trend. From the daily chart structure, the US dollar index is still in the recent oscillating and weak pattern. Although the price has rebounded due to the strong employment data, it is still constrained by the area near the 100-day moving average. The index is currently running below the middle Bollinger Band and in the lower half of the Bollinger Band. The RSI (14) is about 43, indicating that the upward momentum has recovered to some extent, but it has not yet entered a clearly strong range. The first thing to watch above is the resistance near the middle Bollinger Band at 99.35. If this position is effectively broken, the US dollar index is expected to further test the 100-day moving average and the 100 psychological level. Stronger resistance lies around 100.10, near the upper Bollinger Band. A break above this level would significantly improve the short-term bearish structure. On the downside, watch the 100-day moving average around 99.75 and the lower Bollinger Band around 98.60. However, given the current price of around 99.20, the 99.35 level is a crucial point to watch. If the dollar fails to hold above this level, the rebound could turn into a pullback after encountering resistance at higher levels.
 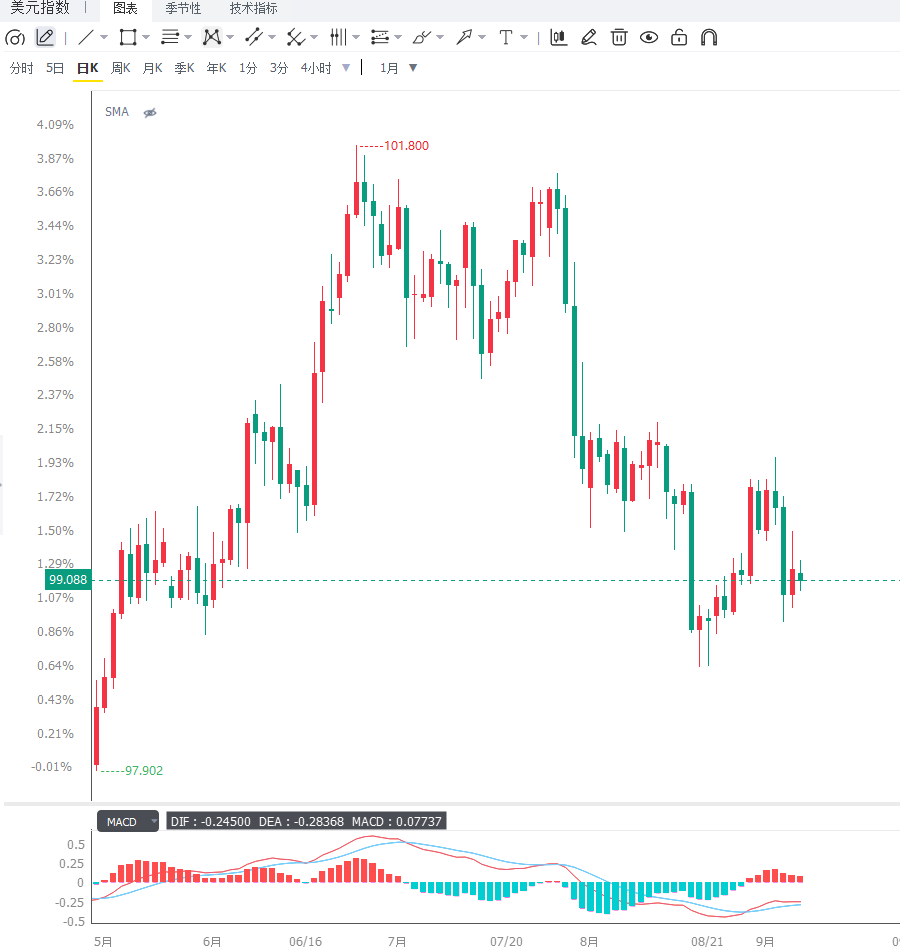 Editor's Summary: Stronger-than-expected US non-farm payroll data for August has renewed market bets on a September rate hike by the Federal Reserve, providing short-term support for the US dollar. However, the dollar index remains below key technical resistance, and its future direction will be determined by PPI and CPI data. If inflation picks up again, the dollar could break above the 100 level; conversely, if inflation cools significantly, rate hike expectations may diminish, limiting the dollar's upside potential. In the short term, 99.35 is a crucial level for both bulls and bears; a break above this level would target 100.10, while a failure to break through could lead to a pullback to around 98.60.
According to the CME FedWatch tool, traders currently expect a 58.3% probability of a Fed rate hike in September, a significant increase from before the release of strong employment data. The resilience of the labor market means the Fed has more room to maintain a tighter policy stance given that inflationary pressures have not yet fully subsided, thus providing short-term support for the dollar and US Treasury yields. However, whether the dollar can further open up upward space still depends on the US inflation data to be released this week. The Producer Price Index (PPI) and Consumer Price Index (CPI) will be the focus of the market. If PPI and CPI continue to perform strongly, it may further strengthen expectations of a September rate hike and push the dollar to retest the 100 level; conversely, if inflation cools significantly, the market may re-bet on the Fed keeping interest rates unchanged, and the dollar's previous gains may face downward pressure. Market strategists believe that strong CPI data could significantly increase the certainty of a September rate hike and further support the dollar; if inflation data is lower than expected, it may weaken rate hike expectations, putting the dollar under renewed pressure to repric a dovish policy stance. From the perspective of interest rate market transmission, recent employment data has already pushed up US Treasury yields and improved the dollar's short-term performance. Strong employment means that the US economy is temporarily more resilient to pressure, and it has also cooled market expectations for a rapid shift to easing. Therefore, the US dollar still has some fundamental support before the release of US inflation data this week. However, it should be noted that the US dollar has not yet formed a clear medium-term upward trend. If subsequent inflation data is insufficient to support the continued rise in interest rate expectations, the US dollar index may fall back to the vicinity of the key moving average. Therefore, the short-term strength of the US dollar is more reflected in the repair of interest rate expectations, rather than the complete establishment of a trend. From the daily chart structure, the US dollar index is still in the recent oscillating and weak pattern. Although the price has rebounded due to the strong employment data, it is still constrained by the area near the 100-day moving average. The index is currently running below the middle Bollinger Band and in the lower half of the Bollinger Band. The RSI (14) is about 43, indicating that the upward momentum has recovered to some extent, but it has not yet entered a clearly strong range. The first thing to watch above is the resistance near the middle Bollinger Band at 99.35. If this position is effectively broken, the US dollar index is expected to further test the 100-day moving average and the 100 psychological level. Stronger resistance lies around 100.10, near the upper Bollinger Band. A break above this level would significantly improve the short-term bearish structure. On the downside, watch the 100-day moving average around 99.75 and the lower Bollinger Band around 98.60. However, given the current price of around 99.20, the 99.35 level is a crucial point to watch. If the dollar fails to hold above this level, the rebound could turn into a pullback after encountering resistance at higher levels. Editor's Summary: Stronger-than-expected US non-farm payroll data for August has renewed market bets on a September rate hike by the Federal Reserve, providing short-term support for the US dollar. However, the dollar index remains below key technical resistance, and its future direction will be determined by PPI and CPI data. If inflation picks up again, the dollar could break above the 100 level; conversely, if inflation cools significantly, rate hike expectations may diminish, limiting the dollar's upside potential. In the short term, 99.35 is a crucial level for both bulls and bears; a break above this level would target 100.10, while a failure to break through could lead to a pullback to around 98.60.
- Risk Warning and Disclaimer
- The market involves risk, and trading may not be suitable for all investors. This article is for reference only and does not constitute personal investment advice, nor does it take into account certain users’ specific investment objectives, financial situation, or other needs. Any investment decisions made based on this information are at your own risk.