US PPI reinforced expectations of a Fed rate hike, leading to a rise in the dollar and US Treasury yields, which put downward pressure on gold prices.
2026-09-10 23:52:06
Gold prices fell on Thursday (September 10) as the dollar held steady, U.S. Treasury yields rose, and expectations of a Federal Reserve rate hike weighed on the market. Traders were also assessing the latest U.S. Producer Price Index (PPI) data. As of press time, spot gold was trading at approximately $4,364.93, down 0.84% on the day.  The US Producer Price Index (PPI) rose 0.4% month-over-month in August, in line with market expectations and faster than the 0.1% increase in July. The annualized producer price index climbed to 5.4%, slightly higher than the expected 5.3% and also higher than the previous 4.8%. The core PPI reading, excluding food and energy prices, was more moderate. It rose 0.2% month-over-month, lower than the expected 0.3% and also lower than the previous month's 0.3% increase. On the annualized basis, core producer price inflation rose to 4.6% from 4.3%, in line with expectations. These figures keep the possibility of a Federal Reserve rate hike firmly on the table. Meanwhile, tensions in the Middle East have pushed up oil prices, exacerbating inflation concerns and reinforcing the case for tightening policy. Market attention is now focused on Friday's US Consumer Price Index (CPI) data, which could determine whether policymakers will proceed with the rate hike debate. According to the CME FedWatch tool, traders are pricing in a 64% probability of a rate hike next week. However, most economists expect the Federal Reserve to keep interest rates unchanged until the end of the year. As a non-interest-bearing asset, gold typically benefits when interest rates are low, as this reduces the opportunity cost of holding the precious metal. DBS strategists cautioned that "energy-driven tightening is a tougher option and could require the Fed to add pressure to economic growth while suppressing inflation expectations," but added that "a credible response from the Fed could support the dollar and ease longer-term inflation concerns." The Dollar Index (DXY), which measures the dollar's performance against six major currencies, traded near 98.96 after briefly rising above 99, remaining above its intraday low of 98.71. Meanwhile, the benchmark 10-year Treasury yield traded near 4.92%, its highest level since November 2023, after the Treasury's larger bond buyback program failed to impress the market. In the short term, gold remains vulnerable to rising expectations of Fed rate hikes and high Treasury yields, while direct support from Middle East tensions is limited. Technical Analysis: Bears maintain control below the 200-day moving average.
 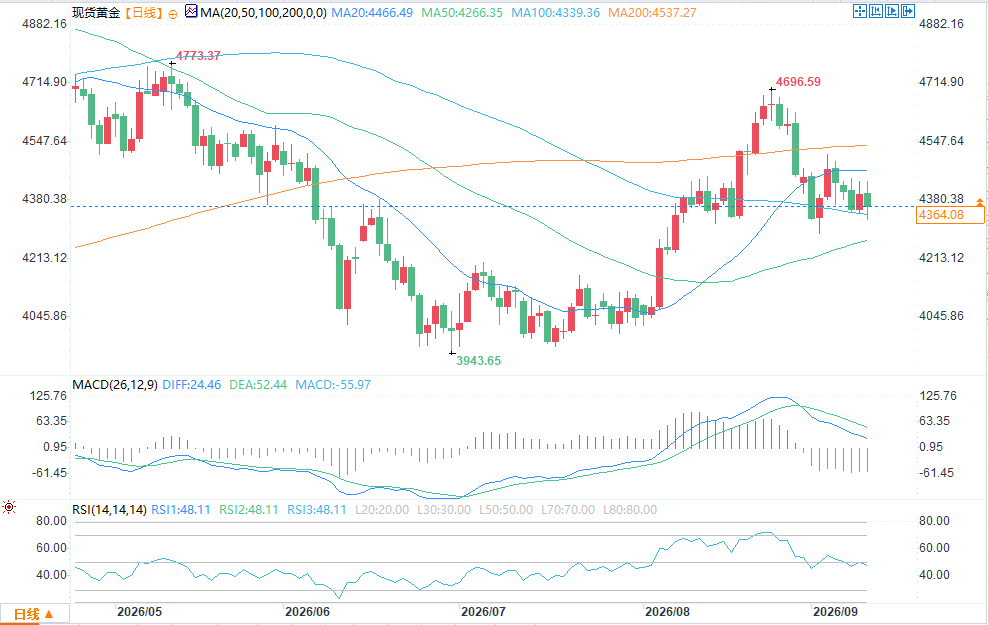 (Spot Gold Daily Chart Source: FX678) On the daily chart, spot gold is holding steady above the 50-day and 100-day moving averages, indicating potential bottoming support, but remains below the 200-day moving average near $4,538, which is limiting overall upside. The Relative Strength Index (RSI) is around 47, pointing to neutral momentum; the Moving Average Convergence/Divergence (MACD) indicator remains below the zero line, with a negative reading and a weak histogram, suggesting that despite the positive underlying structure, any rebound may face selling pressure. On the upside, initial resistance is at the 200-day moving average near $4,538, a break below which would expose the next key hurdle – the horizontal resistance level near $4,700. On the downside, initial support comes from the pivot area near recent closing prices, followed by the 100-day moving average around $4,339 and the 50-day moving average near $4,266. If the price falls further, the key support level of $4,000 will come into view, becoming the next important demand area.
The US Producer Price Index (PPI) rose 0.4% month-over-month in August, in line with market expectations and faster than the 0.1% increase in July. The annualized producer price index climbed to 5.4%, slightly higher than the expected 5.3% and also higher than the previous 4.8%. The core PPI reading, excluding food and energy prices, was more moderate. It rose 0.2% month-over-month, lower than the expected 0.3% and also lower than the previous month's 0.3% increase. On the annualized basis, core producer price inflation rose to 4.6% from 4.3%, in line with expectations. These figures keep the possibility of a Federal Reserve rate hike firmly on the table. Meanwhile, tensions in the Middle East have pushed up oil prices, exacerbating inflation concerns and reinforcing the case for tightening policy. Market attention is now focused on Friday's US Consumer Price Index (CPI) data, which could determine whether policymakers will proceed with the rate hike debate. According to the CME FedWatch tool, traders are pricing in a 64% probability of a rate hike next week. However, most economists expect the Federal Reserve to keep interest rates unchanged until the end of the year. As a non-interest-bearing asset, gold typically benefits when interest rates are low, as this reduces the opportunity cost of holding the precious metal. DBS strategists cautioned that "energy-driven tightening is a tougher option and could require the Fed to add pressure to economic growth while suppressing inflation expectations," but added that "a credible response from the Fed could support the dollar and ease longer-term inflation concerns." The Dollar Index (DXY), which measures the dollar's performance against six major currencies, traded near 98.96 after briefly rising above 99, remaining above its intraday low of 98.71. Meanwhile, the benchmark 10-year Treasury yield traded near 4.92%, its highest level since November 2023, after the Treasury's larger bond buyback program failed to impress the market. In the short term, gold remains vulnerable to rising expectations of Fed rate hikes and high Treasury yields, while direct support from Middle East tensions is limited. Technical Analysis: Bears maintain control below the 200-day moving average. (Spot Gold Daily Chart Source: FX678) On the daily chart, spot gold is holding steady above the 50-day and 100-day moving averages, indicating potential bottoming support, but remains below the 200-day moving average near $4,538, which is limiting overall upside. The Relative Strength Index (RSI) is around 47, pointing to neutral momentum; the Moving Average Convergence/Divergence (MACD) indicator remains below the zero line, with a negative reading and a weak histogram, suggesting that despite the positive underlying structure, any rebound may face selling pressure. On the upside, initial resistance is at the 200-day moving average near $4,538, a break below which would expose the next key hurdle – the horizontal resistance level near $4,700. On the downside, initial support comes from the pivot area near recent closing prices, followed by the 100-day moving average around $4,339 and the 50-day moving average near $4,266. If the price falls further, the key support level of $4,000 will come into view, becoming the next important demand area.
- Risk Warning and Disclaimer
- The market involves risk, and trading may not be suitable for all investors. This article is for reference only and does not constitute personal investment advice, nor does it take into account certain users’ specific investment objectives, financial situation, or other needs. Any investment decisions made based on this information are at your own risk.