Gold found support near a one-month low ahead of the Federal Reserve's interest rate decision.
2026-09-16 01:36:08
On Tuesday (September 15), spot gold halted some of its intraday losses during the US trading session. However, a stronger dollar, persistently high US Treasury yields, and market expectations of a Federal Reserve rate hike hampered the upside potential of this non-interest-bearing asset, limiting gold's upside ahead of Wednesday's Fed monetary policy decision.  Spot gold traded around $4,297, up from $4,253 reached on Monday, a more than one-month low. On Tuesday, yields on U.S. Treasury bonds across all maturities hit multi-year highs. The key 10-year Treasury yield briefly touched 5.04%, its highest since 2007, before retreating to around 5.015%. Higher yields boosted dollar buying, also increasing the opportunity cost of holding gold, a non-interest-bearing asset. The dollar index (DXY), which measures the dollar against a basket of six major currencies, traded around 99.63, near a two-week high. The bond sell-off is not unique to the U.S.; borrowing costs in several major economies have also climbed to multi-year highs. This significant market movement is largely driven by the energy shock from the Middle East conflict, exacerbating inflation concerns and further reinforcing market expectations of monetary policy tightening. Since the outbreak of the conflict, gold prices have reacted more strongly to changes in interest rate expectations than to geopolitical developments. So far, the Federal Reserve has kept interest rates unchanged, but high oil prices make it more difficult for inflation to fall back to the central bank's 2% target level. The US Consumer Price Index (CPI) rose 3.4% year-on-year in August; the Producer Price Index (PPI) accelerated to 5.4% year-on-year from 4.8% in July. The core of the Federal Reserve's recent statements remains to bring inflation back to its target level. Therefore, the market widely expects the Fed to begin its first interest rate hike since 2023 after the two-day monetary policy meeting concludes on Wednesday. The market seems to have already priced in most of the risks of a hawkish stance from the Fed. However, if policymakers signal that a wider tightening cycle will begin in September, gold may still be under pressure. This signal could push US Treasury yields further up, providing more support for the dollar. Therefore, the market focus will be on updated economic forecasts and Fed Chairman Kevin Warsh's speech on the interest rate path. Meanwhile, the rise in global bond yields is not solely due to monetary policy expectations. Large-scale government borrowing in major economies and market concerns about fiscal sustainability have also contributed to the bond sell-off. If higher yields begin to reflect weakening market confidence in government debt, these factors may ultimately reignite demand for gold as a store of value. During this period, central bank gold purchases, retail investment, and inflows into gold ETFs continued to provide underlying support for gold prices. Technical Analysis: Gold broke below a key moving average, increasing downside risk and accumulating bearish momentum.
 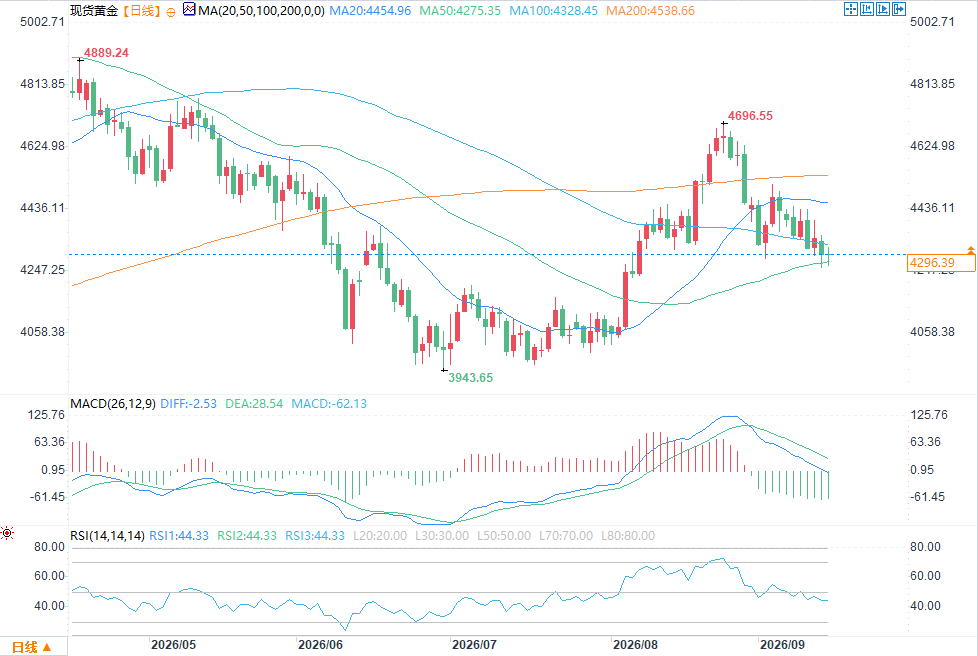 (Spot Gold Daily Chart Source: FX678) On the daily chart, spot gold is trading below the 100-day and 200-day simple moving averages, maintaining a short-term bearish bias. Gold prices are slightly above the 50-day moving average around $4275, providing initial support; however, the Relative Strength Index (RSI) has fallen back to around 43, and the MACD histogram is negative and continuing to decline, indicating increasing bearish momentum and the overall rebound faces further downside risk. Initial resistance is at the 100-day moving average at $4328; stronger resistance lies at the 200-day moving average around $4539, and the horizontal resistance level at $4700. On the downside, a break below the 50-day moving average at $4275 would see support at $4150 and $4000, where bulls may reassess the medium-term trend.
Spot gold traded around $4,297, up from $4,253 reached on Monday, a more than one-month low. On Tuesday, yields on U.S. Treasury bonds across all maturities hit multi-year highs. The key 10-year Treasury yield briefly touched 5.04%, its highest since 2007, before retreating to around 5.015%. Higher yields boosted dollar buying, also increasing the opportunity cost of holding gold, a non-interest-bearing asset. The dollar index (DXY), which measures the dollar against a basket of six major currencies, traded around 99.63, near a two-week high. The bond sell-off is not unique to the U.S.; borrowing costs in several major economies have also climbed to multi-year highs. This significant market movement is largely driven by the energy shock from the Middle East conflict, exacerbating inflation concerns and further reinforcing market expectations of monetary policy tightening. Since the outbreak of the conflict, gold prices have reacted more strongly to changes in interest rate expectations than to geopolitical developments. So far, the Federal Reserve has kept interest rates unchanged, but high oil prices make it more difficult for inflation to fall back to the central bank's 2% target level. The US Consumer Price Index (CPI) rose 3.4% year-on-year in August; the Producer Price Index (PPI) accelerated to 5.4% year-on-year from 4.8% in July. The core of the Federal Reserve's recent statements remains to bring inflation back to its target level. Therefore, the market widely expects the Fed to begin its first interest rate hike since 2023 after the two-day monetary policy meeting concludes on Wednesday. The market seems to have already priced in most of the risks of a hawkish stance from the Fed. However, if policymakers signal that a wider tightening cycle will begin in September, gold may still be under pressure. This signal could push US Treasury yields further up, providing more support for the dollar. Therefore, the market focus will be on updated economic forecasts and Fed Chairman Kevin Warsh's speech on the interest rate path. Meanwhile, the rise in global bond yields is not solely due to monetary policy expectations. Large-scale government borrowing in major economies and market concerns about fiscal sustainability have also contributed to the bond sell-off. If higher yields begin to reflect weakening market confidence in government debt, these factors may ultimately reignite demand for gold as a store of value. During this period, central bank gold purchases, retail investment, and inflows into gold ETFs continued to provide underlying support for gold prices. Technical Analysis: Gold broke below a key moving average, increasing downside risk and accumulating bearish momentum. (Spot Gold Daily Chart Source: FX678) On the daily chart, spot gold is trading below the 100-day and 200-day simple moving averages, maintaining a short-term bearish bias. Gold prices are slightly above the 50-day moving average around $4275, providing initial support; however, the Relative Strength Index (RSI) has fallen back to around 43, and the MACD histogram is negative and continuing to decline, indicating increasing bearish momentum and the overall rebound faces further downside risk. Initial resistance is at the 100-day moving average at $4328; stronger resistance lies at the 200-day moving average around $4539, and the horizontal resistance level at $4700. On the downside, a break below the 50-day moving average at $4275 would see support at $4150 and $4000, where bulls may reassess the medium-term trend.
- Risk Warning and Disclaimer
- The market involves risk, and trading may not be suitable for all investors. This article is for reference only and does not constitute personal investment advice, nor does it take into account certain users’ specific investment objectives, financial situation, or other needs. Any investment decisions made based on this information are at your own risk.