Gold prices were supported by buying for two consecutive days, but a hawkish Federal Reserve and geopolitical risks limited upside potential.
2026-09-18 14:04:10
Spot gold saw buying interest for the second consecutive trading day, but prices failed to break through the week's high during Friday's Asian trading session, with market signals showing a mixed picture. The decline in international crude oil prices led to a continued drop in US Treasury yields from multi-year highs, easing short-term concerns about runaway inflation and weakening the dollar's bullish momentum, thus providing support for gold as a non-interest-bearing asset. The Federal Reserve's hawkish policy expectations continued to benefit the dollar, suppressing investors' willingness to aggressively buy gold. Coupled with ongoing geopolitical conflicts in the Middle East, gold prices are caught in a dilemma. Subsequent US industrial production data, speeches by Federal Reserve officials, and developments in the Middle East will all determine the short-term direction of gold prices before the weekend. UOB analysts point out that the Federal Reserve's resumption of its interest rate hike cycle is reshaping the dollar's outlook. The bank states that it currently expects the Fed to raise rates twice more, potentially reversing the narrowing interest rate differential between the US and Europe that has been suppressing the dollar index since the end of 2024, which would be beneficial for the dollar index. Against this backdrop, UOB believes its previously cautious dollar assessment is facing challenges, with the dollar facing upside risks against G10 currencies and Asian currencies. Data from the CME Group's FedWatch Tool shows that market traders predict a 54% probability of another Fed rate hike in October and approximately an 88% probability in December. Geopolitical uncertainty is also boosting the dollar as a safe-haven asset, limiting gold's upside potential. Recently, Iran's Islamic Revolutionary Guard Corps claimed to have struck a Togolese oil tanker attempting to illegally cross the Strait of Hormuz, and US President Trump stated that he is considering resuming large-scale strikes against Iran, further boosting dollar bullish sentiment.
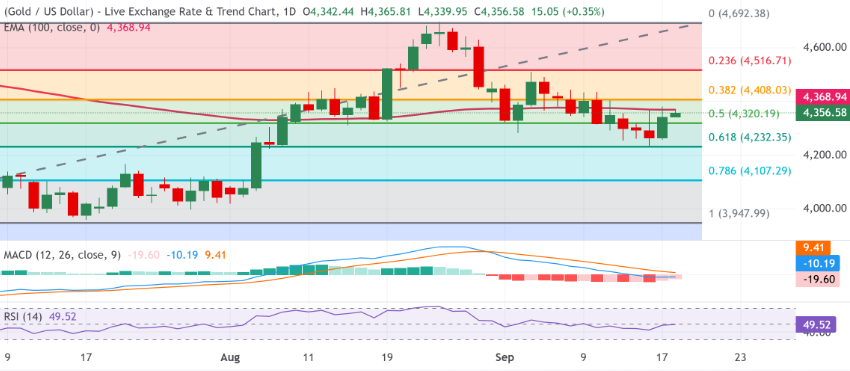 Chart: Daily chart of spot gold price
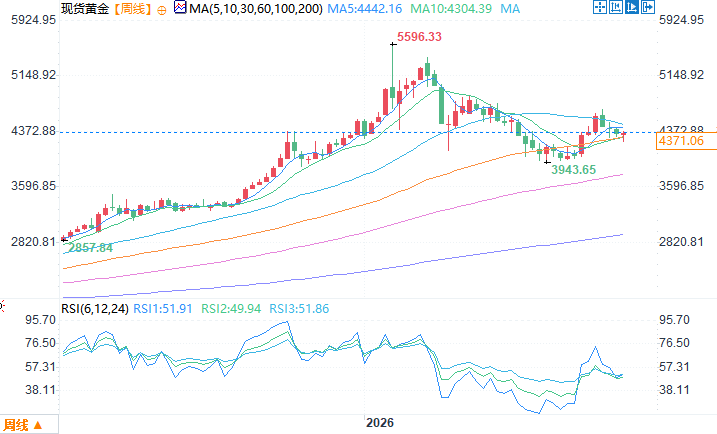 Spot gold weekly chart source: EasyTrade. At 14:02 Beijing time on September 18, spot gold was trading at $4383.06 per ounce.
The Fed's hawkish rate hike has been implemented, and multiple macroeconomic factors are influencing gold price movements.
Following its policy meeting, the Federal Reserve unanimously voted to raise interest rates for the first time since 2023. The dot plot indicates that Fed officials generally anticipate another rate hike later this year. Fed Chairman Kevin Warsh stated at the post-meeting press conference that price stability is a crucial prerequisite for US economic growth, and the persistently high inflation problem urgently needs to be addressed. Continued tensions in the Middle East are supporting oil prices, and market concerns about energy-driven inflation are further reinforcing expectations that the Fed will continue to tighten monetary policy. UOB analysts point out that the Federal Reserve's resumption of its interest rate hike cycle is reshaping the dollar's outlook. The bank states that it currently expects the Fed to raise rates twice more, potentially reversing the narrowing interest rate differential between the US and Europe that has been suppressing the dollar index since the end of 2024, which would be beneficial for the dollar index. Against this backdrop, UOB believes its previously cautious dollar assessment is facing challenges, with the dollar facing upside risks against G10 currencies and Asian currencies. Data from the CME Group's FedWatch Tool shows that market traders predict a 54% probability of another Fed rate hike in October and approximately an 88% probability in December. Geopolitical uncertainty is also boosting the dollar as a safe-haven asset, limiting gold's upside potential. Recently, Iran's Islamic Revolutionary Guard Corps claimed to have struck a Togolese oil tanker attempting to illegally cross the Strait of Hormuz, and US President Trump stated that he is considering resuming large-scale strikes against Iran, further boosting dollar bullish sentiment.Short-term trading strategy: Wait for sustained buying signals and closely monitor tonight's US economic data.
Gold prices rebounded after hitting a six-week low on Wednesday (September 16), but investors should not bet too early on a continued rebound and need to wait for stronger, sustained buying signals. Friday will see the release of secondary economic data, including US industrial production and capacity utilization. During the North American trading session, several key officials from the Federal Open Market Committee will speak, and their comments will influence the dollar's performance, providing new volatility for gold prices. Towards the weekend, the latest developments in the Middle East crisis will also present short-term trading opportunities for spot gold, as geopolitical risks can change asset pricing logic at any time. Chart: Daily chart of spot gold priceTechnical Analysis: Downward Pressure Has Not Completely Dissipated
From a technical perspective, although gold prices have stabilized above a key Fibonacci support level, the short-term trend remains bearish. Gold prices are hovering above the 50% Fibonacci retracement level of $4320, a relatively weak support level after the previous decline. The Relative Strength Index (RSI) is at 49.52, near the neutral zone, while the MACD is at -19.60, remaining in negative territory, indicating continued downward pressure. On the upside, the first resistance level is the 38.2% Fibonacci retracement level at $4408, with stronger resistance at the 23.6% Fibonacci retracement level at $4516 and the previous high of $4692. On the downside, the first support level is at the 50% Fibonacci retracement level of $4320, with deeper support at $4232 and $4107. If selling pressure continues to increase, the further structural support area is at $3947.Conclusion
The gold market is currently in a delicate phase of tug-of-war between bulls and bears. Falling US Treasury yields are providing support, while hawkish expectations from the Federal Reserve, a stronger dollar, and ongoing geopolitical risks are exerting downward pressure. Fundamentally, expectations for a Fed rate hike this year remain high, and institutions like UOB are bullish on a stronger dollar. Technically, gold prices have encountered resistance during their rebound, and indicators suggest that bearish momentum has not completely subsided. Investors need to continuously monitor US economic data, Fed officials' statements, and developments in the Middle East, carefully navigating short-term gold price opportunities amidst these multiple variables. Spot gold weekly chart source: EasyTrade. At 14:02 Beijing time on September 18, spot gold was trading at $4383.06 per ounce.
- Risk Warning and Disclaimer
- The market involves risk, and trading may not be suitable for all investors. This article is for reference only and does not constitute personal investment advice, nor does it take into account certain users’ specific investment objectives, financial situation, or other needs. Any investment decisions made based on this information are at your own risk.