Brent crude oil fell from 109.7 to 101: Is the market dismantling the premium, or is it a false pullback before the next disruption?
2026-09-21 20:40:10
On Monday, September 21, Brent crude oil was trading around $101 per barrel, down about 2% from the previous trading day. West Texas Intermediate crude oil also fell to around $93-94 per barrel. The pricing logic has shifted from the shock trading of the "sudden interruption of export channels" in mid-September to two more subtle clues: whether the Saudi East-West pipeline can partially resume operation according to the publicly announced timetable, and whether diplomatic contacts during the UN General Assembly window will further compress the risk premium. Brent crude oil recorded a high of around $109.70 per barrel this month, and has since fallen continuously, indicating that the market is re-analyzing the premium structure, rather than simply extrapolating the interruption narrative linearly. 
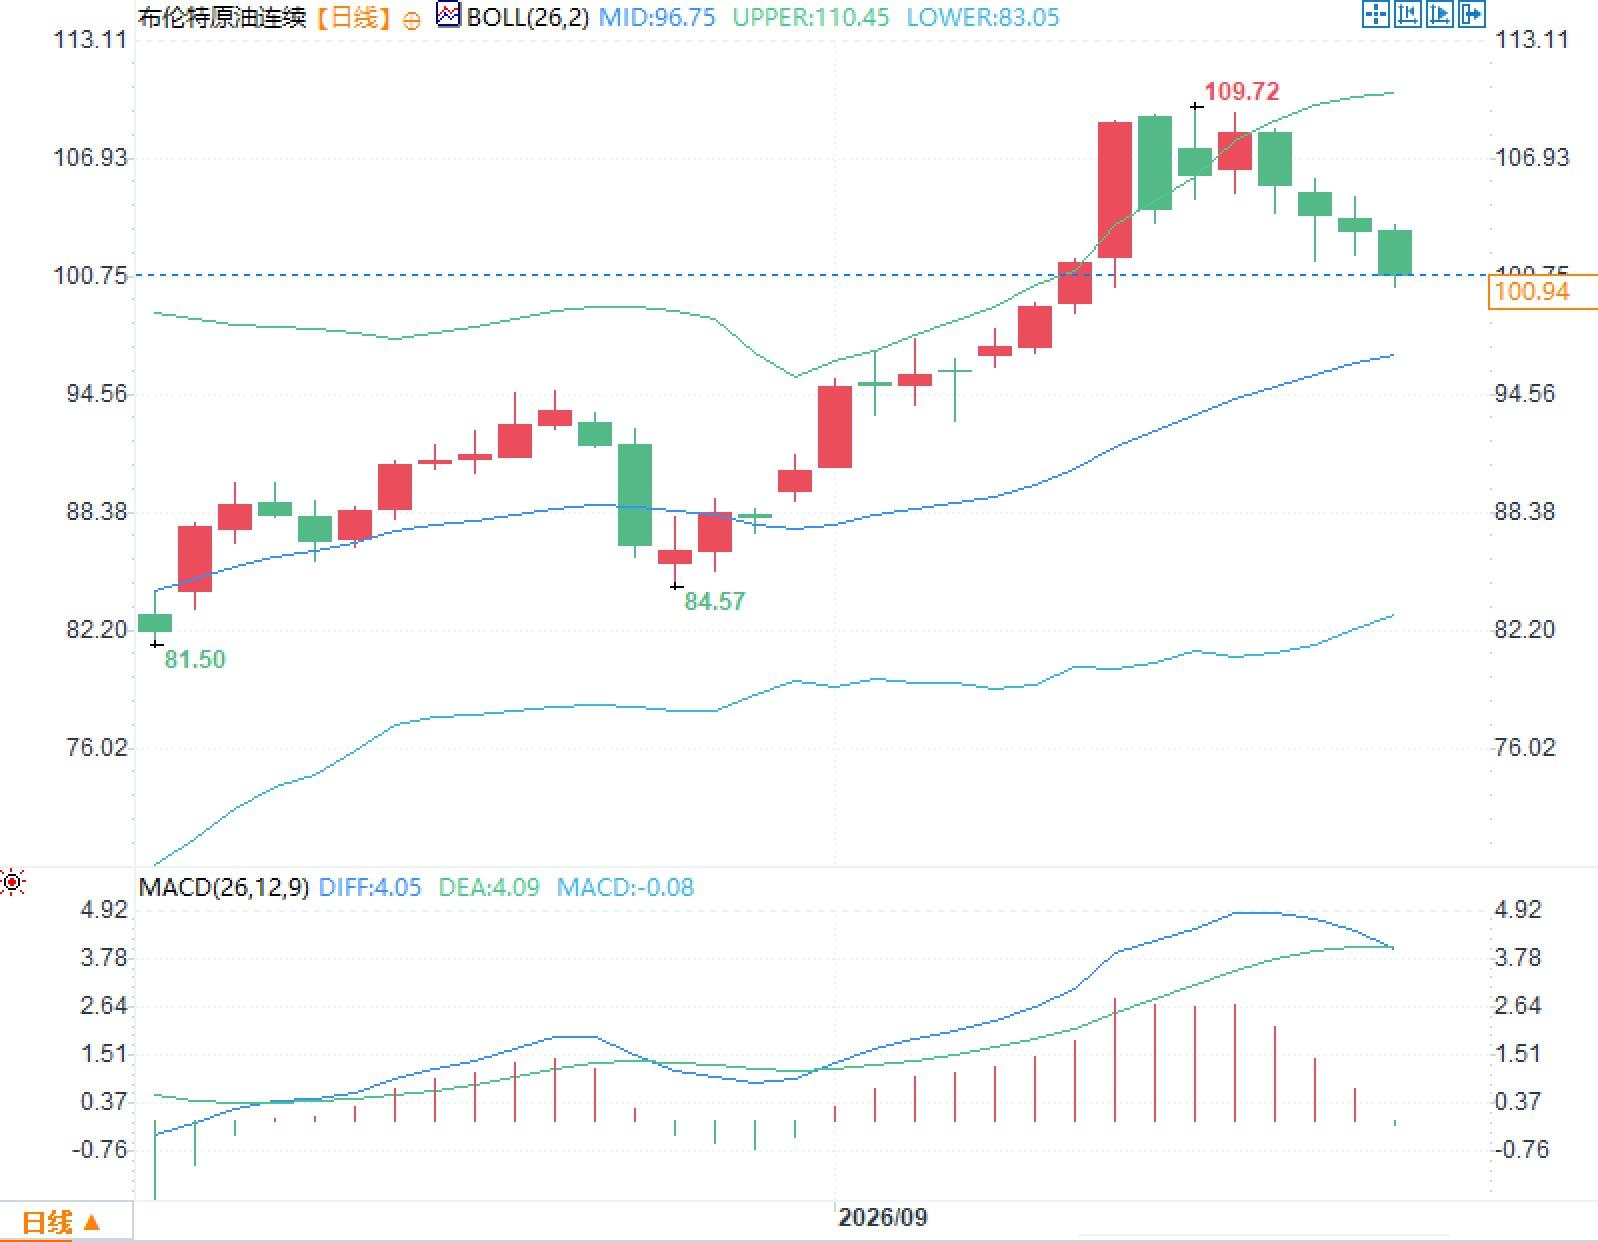 The MACD indicator shows DIFF at 4.05, DEA at 4.09, and the histogram at -0.08. The two signal lines are almost flat, and the histogram has narrowed from consecutive positive values to near the zero line. More useful is the structural meaning: wide bandwidth and converging momentum typically correspond to event-driven market conditions. Market depth changes rapidly with news events, and intraday volatility may still be significantly higher than the August average.
The pace of resumption of operations on the East-West pipeline has become the primary variable in supply pricing.
After drone attacks around September 10 forced the suspension of the East-West Pipeline, this route through the Arabian Peninsula and to Yanbu Port on the Red Sea transformed from a "backup plan to bypass the Strait of Hormuz" into an amplifier of spot market shortages. Public information shows that before the pipeline shutdown, it transported approximately 4 to 5 million barrels per day, equivalent to 4% to 5% of global supply; the system's designed capacity is approximately 7 million barrels per day. Saudi Arabia subsequently released a clear repair plan: first, bypass the damaged section of the pipeline, aiming to restore about half of the capacity within a few days, with full repairs taking about six weeks. US Energy Secretary Wright stated that the assessment is still ongoing, but the resumption time "will be measured in days," and mentioned that Saudi Arabia is trying to divert more crude oil away from the Strait of Hormuz. The key message here isn't in the attitude, but in the timeline: if flow can truly recover to approximately 2 million to 2.5 million barrels per day within a few days, the risk of depleting Yanbu port's pending loading inventory will be postponed; however, if actual throughput falls below the verbal estimate of "half capacity," or if damage to the pumping station's electrical structure extends the construction period from a few days to several weeks, the discount structure will steepen again. According to the International Energy Agency, August flow through the Strait of Hormuz was approximately 7.6 million barrels per day, a significant contraction compared to pre-conflict levels; exports via bypass routes such as Yanbu and Fujairah had already fallen to approximately 5.5 million barrels per day in August. The pipeline shutdown occurred against the backdrop of already declining bypass flow; therefore, the progress of resumption directly determines whether the physical shortfall in the third quarter will be partially filled or whether the port will continue to rely on increased output from other producing regions.The UN window is rewriting the premium period, not the geological reserves.
The 81st session of the United Nations General Assembly is scheduled to hold its general debate in New York from September 22 to 26 and 28. Iranian President Pezechzian has confirmed that he will lead a delegation to the General Assembly and plans to present his position and meet with leaders of many countries. The US has approved visas for the core delegation. US President Trump stated that he is "probably willing" to meet with Pezechzian during the General Assembly, while saying that the decision-making process is currently underway. The impact of such events on crude oil is essentially to compress or reopen the near-month risk premium, rather than immediately rewriting underground reserves. The market previously attached a rapidly variable premium to Middle East conflicts, waterway restrictions, and infrastructure attacks; once verifiable contact occurs, near-month contracts often react before far-month contracts, because near-month contracts carry the cash flow of "whether shipments can be made this week, and whether premiums will jump again." Conversely, if the meetings remain merely symbolic and waterway disturbances escalate again, the premium will be pushed back down at the same speed. The passage through the Hormuz, Red Sea disturbances, and pipeline repairs are three parallel physical constraints; diplomatic schedules can only change the weight of these three constraints in the market's simultaneous pricing.Brent daily chart structure: Bandwidth remains wide, momentum indicators are entering a convergence phase.
From a daily chart perspective, a period of high-volume volatility occurred in early to mid-September, extending near the upper Bollinger Band. The middle Bollinger Band is around $96.75 per barrel, the upper band is around $110.45 per barrel, and the lower band is around $83.05 per barrel. The bandwidth is still significantly wider than the contraction phase from late August to early September, indicating that the September shock has pushed volatility to a higher level, and mean reversion has not yet been completed. The MACD indicator shows DIFF at 4.05, DEA at 4.09, and the histogram at -0.08. The two signal lines are almost flat, and the histogram has narrowed from consecutive positive values to near the zero line. More useful is the structural meaning: wide bandwidth and converging momentum typically correspond to event-driven market conditions. Market depth changes rapidly with news events, and intraday volatility may still be significantly higher than the August average.How much physical gap was offset by inventory and demand?
The International Energy Agency's balance sheet estimates the global deficit for the second quarter of 2026 at approximately 2.2 million barrels per day (bpd) and the third quarter at approximately 1.7 million bpd, significantly less than the book losses at the Hormuz line. The difference stems from three sources: cumulative increases in production outside the Gulf, temporary increases in transit ports, and the suppression of consumption by high prices. The agency has lowered its 2026 global demand forecast to a year-on-year contraction, with a larger contraction in the second quarter and a narrowing in the third. High prices themselves are already offsetting demand, and refinery purchasing cycles and crack spreads are better indicators of whether the "gap has been absorbed" than paper prices. The latest weekly commercial crude oil inventory data from the U.S. Energy Information Administration (EIA) (ending September 11) is 423.4 million barrels, a decrease of approximately 600,000 barrels from the previous week, but still slightly higher than the five-year average for the same period by about 1%. Strategic petroleum reserves are approximately 285 million barrels, with limited change. Cushing inventories continue to decline slightly. The next weekly report is scheduled for release on September 23, coinciding with the UN General Assembly general debate. If Atlantic Basin inventories continue to decline at a gradual, seasonal pace, it indicates that the geopolitical premium in the paper market and the tight balance in the physical market are not the same thing. Only if the decline suddenly accelerates and is accompanied by a widening of refined product cracking will it mean that the losses from bypass routes are beginning to penetrate to the refinery gates. Some European refineries are already looking for North Sea and medium-grade alternative sources. This is the most direct regional rebalancing after the pipeline shutdown, rather than a simple increase or decrease in global barrels.- Risk Warning and Disclaimer
- The market involves risk, and trading may not be suitable for all investors. This article is for reference only and does not constitute personal investment advice, nor does it take into account certain users’ specific investment objectives, financial situation, or other needs. Any investment decisions made based on this information are at your own risk.