Gold prices held steady above $4,300, while oil prices retreated but yields remained high.
2026-09-21 22:16:10
Gold prices fell during Monday's (September 21) early U.S. trading session, while silver prices edged lower. High U.S. Treasury yields and a stronger dollar offset safe-haven buying support from tensions between the U.S. and Iran and restrictions on navigation in the Strait of Hormuz. Spot gold traded around $4,347.67 per ounce, down 0.69% on the day; spot silver was at $66.230, down 0.04% on the day.  A series of economic data released last Friday provided some fundamental support for precious metals, but did not change the constraints of monetary policy. Recent economic data showed weakening industrial momentum and declining leading demand signals, but this has not dispelled the Federal Reserve's concerns about inflation. Chicago Federal Reserve Bank President Austan Goolsby said on Monday morning that supply shocks may force the United States to make a "painful trade-off" between employment and inflation. The market is therefore continuing to focus on whether oil prices, service sector inflation, and artificial intelligence-related demand will further prolong the Fed's tightening cycle. The latest market positioning is generally defensive, but compared to the extreme one-sided market conditions earlier this month, the positioning structure has eased. The latest Commitment of Traders report from the Commodity Futures Trading Commission (CFTC) shows that managed funds held 133,116 net long positions in gold futures on the COMEX exchange, a decrease of 1,856 contracts from the previous week; the net long position in silver futures was even smaller, at 13,124 contracts. Gold long positions were more concentrated than silver due to weaker US output and leading indicators data last Friday. However, macroeconomic price fluctuations were primarily driven by a reassessment of Federal Reserve policy expectations, rather than concerns about economic growth. Last week, the Federal Open Market Committee (FOMC) raised the target range for the federal funds rate by 25 basis points to 3.75%-4.00%; interest rate futures market pricing indicates a roughly 53% probability of another Fed rate hike in October. Short-term yields remained high, supporting the dollar and making it difficult for gold to achieve a clear upward breakout based on weak economic data. The Strait of Hormuz remains a core geopolitical risk premium factor driving the gold, crude oil, and tanker markets. At the end of last week, the number of trackable commodity vessels passing through the strait decreased from 37 a week earlier to 17; however, some Middle Eastern export vessels continued sailing with their transponders off, indicating that trade was not completely disrupted. Therefore, the current situation has not resulted in a complete blockade, but shipping has not yet returned to normal. Oil prices declined in early trading today, navigation conditions in the strait improved somewhat, and relevant diplomatic channels of the UN General Assembly maintained communication. Brent crude oil is around $100.43 per barrel, and West Texas Intermediate (WTI) crude oil is around $92.52 per barrel. The decline in oil prices has eased the immediate inflationary impact, putting some downward pressure on yields; however, shipping risks remain, providing support for gold on dips, while energy-driven inflation expectations still warrant attention. Naim Aslan, Chief Investment Officer of Zaye Capital Markets, believes that gold prices are currently caught between two forces: on the one hand, US-China trade risks have eased somewhat; on the other hand, geopolitical pressures such as the situation in Iran, Russian sanctions, and security negotiations persist. His core view is that the safe-haven buying of gold remains fundamental, but high yields are still the main factor hindering gold prices from effectively breaking through previous highs. Regarding silver, Aslan stated that silver prices are influenced by both monetary policy and industrial demand. China maintained its one-year and five-year loan prime rates unchanged at 3.00% and 3.50% respectively, implying that overall industrial demand expectations are stable, with no strong bullish signals. The US bond market remains the core source of market pressure. The 10-year US Treasury yield once touched its highest level since 2007 and is currently fluctuating around 5%; the rise in yields is no longer solely driven by Federal Reserve policy. The total US public debt is approximately $40.05 trillion; the latest benchmark forecast from the Congressional Budget Office (CBO) shows that the ratio of public debt to GDP will rise from 101% in 2026 to 120% in 2036, while net interest payments as a percentage of GDP are expected to climb from 3.3% to 4.6% during the same period. For gold, this constitutes a contradictory signal: concerns about fiscal sustainability are logically beneficial to hard assets in the long term; however, the short-term reality is that tighter financial conditions and higher real yields will exert greater downward pressure on precious metals that do not generate interest income. Gold Technical Analysis
 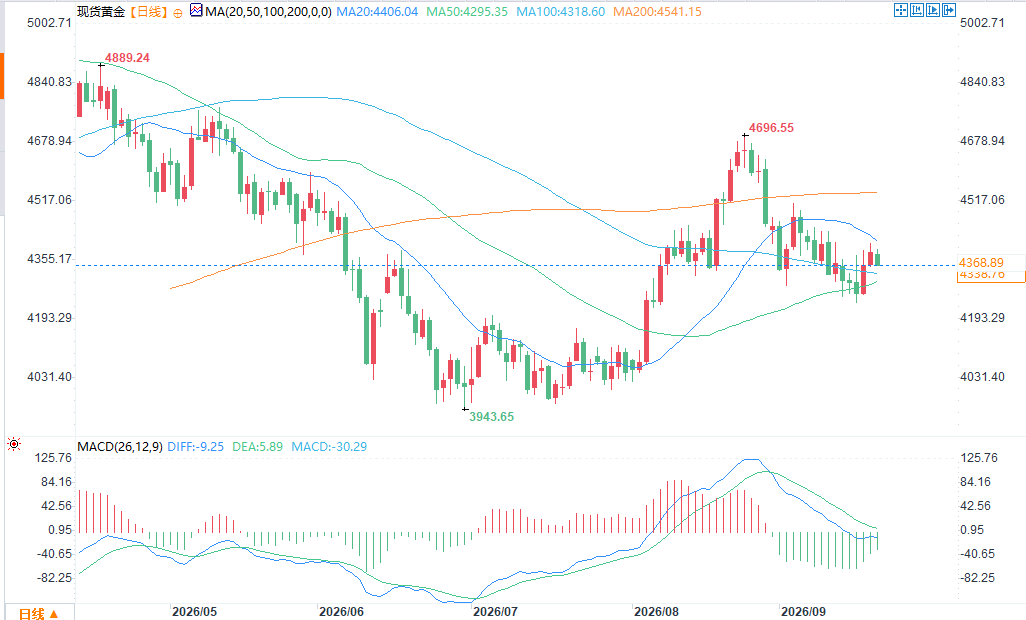 The next upside target for spot gold bulls is to push the price back above the $4407.27-$4530 resistance zone. A successful break above this zone would target $4800, followed by a challenge of the $5000 mark. The short-term downside target for bears is a break below $4341.90, followed by $4300, and then $4150. The first resistance level is $4407.27, followed by $4530; the first support level is $4341.90, followed by $4300. Silver technical analysis...
 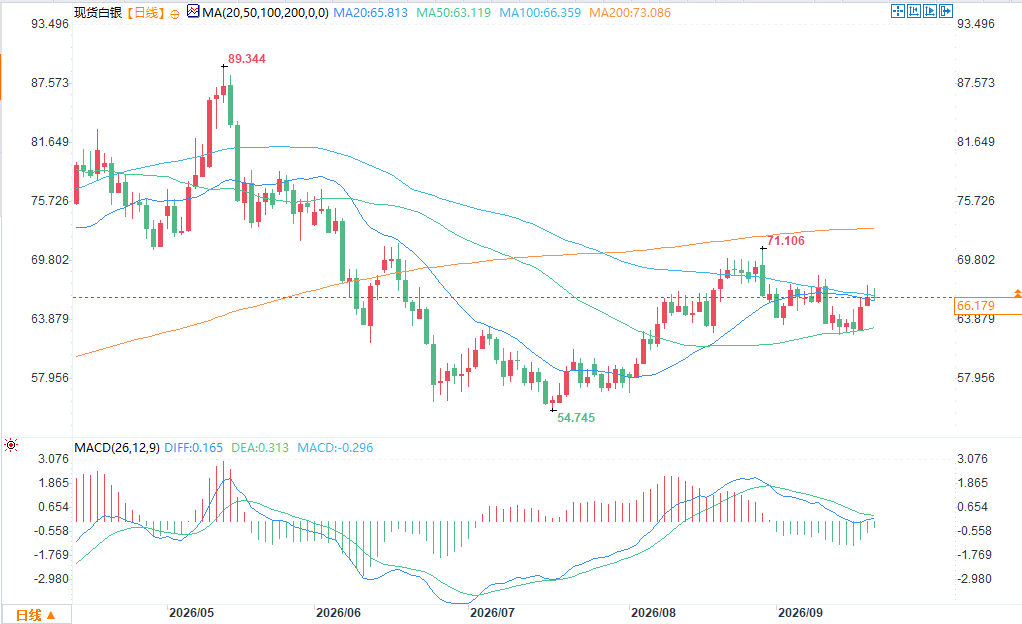 The next upside target for spot silver bulls is to push the price above $67.2747-$67.80, and a break above this range would target $72, testing the previous breakout level at $72. The downside target for bears is a break below $65.2992, followed by $63, and then a test of $60. The first resistance level is $67.2747, followed by $67.80; the first support level is $65.2992, followed by $63.00.
A series of economic data released last Friday provided some fundamental support for precious metals, but did not change the constraints of monetary policy. Recent economic data showed weakening industrial momentum and declining leading demand signals, but this has not dispelled the Federal Reserve's concerns about inflation. Chicago Federal Reserve Bank President Austan Goolsby said on Monday morning that supply shocks may force the United States to make a "painful trade-off" between employment and inflation. The market is therefore continuing to focus on whether oil prices, service sector inflation, and artificial intelligence-related demand will further prolong the Fed's tightening cycle. The latest market positioning is generally defensive, but compared to the extreme one-sided market conditions earlier this month, the positioning structure has eased. The latest Commitment of Traders report from the Commodity Futures Trading Commission (CFTC) shows that managed funds held 133,116 net long positions in gold futures on the COMEX exchange, a decrease of 1,856 contracts from the previous week; the net long position in silver futures was even smaller, at 13,124 contracts. Gold long positions were more concentrated than silver due to weaker US output and leading indicators data last Friday. However, macroeconomic price fluctuations were primarily driven by a reassessment of Federal Reserve policy expectations, rather than concerns about economic growth. Last week, the Federal Open Market Committee (FOMC) raised the target range for the federal funds rate by 25 basis points to 3.75%-4.00%; interest rate futures market pricing indicates a roughly 53% probability of another Fed rate hike in October. Short-term yields remained high, supporting the dollar and making it difficult for gold to achieve a clear upward breakout based on weak economic data. The Strait of Hormuz remains a core geopolitical risk premium factor driving the gold, crude oil, and tanker markets. At the end of last week, the number of trackable commodity vessels passing through the strait decreased from 37 a week earlier to 17; however, some Middle Eastern export vessels continued sailing with their transponders off, indicating that trade was not completely disrupted. Therefore, the current situation has not resulted in a complete blockade, but shipping has not yet returned to normal. Oil prices declined in early trading today, navigation conditions in the strait improved somewhat, and relevant diplomatic channels of the UN General Assembly maintained communication. Brent crude oil is around $100.43 per barrel, and West Texas Intermediate (WTI) crude oil is around $92.52 per barrel. The decline in oil prices has eased the immediate inflationary impact, putting some downward pressure on yields; however, shipping risks remain, providing support for gold on dips, while energy-driven inflation expectations still warrant attention. Naim Aslan, Chief Investment Officer of Zaye Capital Markets, believes that gold prices are currently caught between two forces: on the one hand, US-China trade risks have eased somewhat; on the other hand, geopolitical pressures such as the situation in Iran, Russian sanctions, and security negotiations persist. His core view is that the safe-haven buying of gold remains fundamental, but high yields are still the main factor hindering gold prices from effectively breaking through previous highs. Regarding silver, Aslan stated that silver prices are influenced by both monetary policy and industrial demand. China maintained its one-year and five-year loan prime rates unchanged at 3.00% and 3.50% respectively, implying that overall industrial demand expectations are stable, with no strong bullish signals. The US bond market remains the core source of market pressure. The 10-year US Treasury yield once touched its highest level since 2007 and is currently fluctuating around 5%; the rise in yields is no longer solely driven by Federal Reserve policy. The total US public debt is approximately $40.05 trillion; the latest benchmark forecast from the Congressional Budget Office (CBO) shows that the ratio of public debt to GDP will rise from 101% in 2026 to 120% in 2036, while net interest payments as a percentage of GDP are expected to climb from 3.3% to 4.6% during the same period. For gold, this constitutes a contradictory signal: concerns about fiscal sustainability are logically beneficial to hard assets in the long term; however, the short-term reality is that tighter financial conditions and higher real yields will exert greater downward pressure on precious metals that do not generate interest income. Gold Technical Analysis The next upside target for spot gold bulls is to push the price back above the $4407.27-$4530 resistance zone. A successful break above this zone would target $4800, followed by a challenge of the $5000 mark. The short-term downside target for bears is a break below $4341.90, followed by $4300, and then $4150. The first resistance level is $4407.27, followed by $4530; the first support level is $4341.90, followed by $4300. Silver technical analysis... The next upside target for spot silver bulls is to push the price above $67.2747-$67.80, and a break above this range would target $72, testing the previous breakout level at $72. The downside target for bears is a break below $65.2992, followed by $63, and then a test of $60. The first resistance level is $67.2747, followed by $67.80; the first support level is $65.2992, followed by $63.00.
- Risk Warning and Disclaimer
- The market involves risk, and trading may not be suitable for all investors. This article is for reference only and does not constitute personal investment advice, nor does it take into account certain users’ specific investment objectives, financial situation, or other needs. Any investment decisions made based on this information are at your own risk.