Gold Consolidates as Iranian Diplomatic Hopes Clash with Hawkish Expectations from the Federal Reserve
2026-09-23 01:18:11
On Tuesday (September 22), spot gold consolidated. On one hand, the market digested the latest news from the Middle East; on the other hand, overall geopolitical tensions remained high. Gold prices rebounded from an intraday low of $4291 and traded around $4338.  Earlier on Tuesday, a report citing a senior Iranian official stated that Iran proposed reopening the Strait of Hormuz within seven days if the United States lifted its blockade of Iranian ports and eased military pressure. This proposal was reportedly conveyed to Washington through mediators. This news caused the dollar to give back some of its earlier gains, helping gold prices recover some losses; meanwhile, crude oil prices continued their decline, recording their fifth consecutive day of losses. However, as the market interpreted Trump's remarks, both the dollar and crude oil rebounded to some extent. Trump stated that the United States hopes to reach an agreement with Iran after the midterm elections on November 3. The dollar index traded around 100.60, slightly below the intraday high of 100.69, the highest level since July 30. Meanwhile, West Texas Intermediate (WTI) crude oil prices approached $90, down about 1.31%. For gold, the main bearish factor remains the hawkish policy stance of the Federal Reserve. Unless the Strait of Hormuz reopens, significantly lowering oil prices and easing inflation concerns, gold prices are unlikely to see a strong rebound. Gold itself does not generate interest income, and rising borrowing costs often suppress gold prices. Last week, the Federal Reserve raised the federal funds rate by 25 basis points, bringing the rate range to 3.75%–4.00%, as policymakers addressed stubborn inflation and persistently high energy prices. Of the 18 Fed officials, 16 expect at least one more rate hike this year. ING analysts noted, “Gold prices weakened slightly at the beginning of the week as investors assessed the impact of the Fed’s first rate hike since 2023 and the possibility of further tightening of monetary policy.” Analysts mentioned that public statements by Fed officials “further reinforced concerns about persistently high inflation,” thus “supporting market expectations that interest rates will remain high for a longer period.” ING acknowledges that “tightening monetary policy remains a headwind for gold,” but also points out that gold ETF holdings are at a six-month high, and continued gold purchases by central banks will buffer the downside potential of gold prices. Technical Analysis: Spot gold has stabilized above the 50-day and 100-day simple moving averages.
 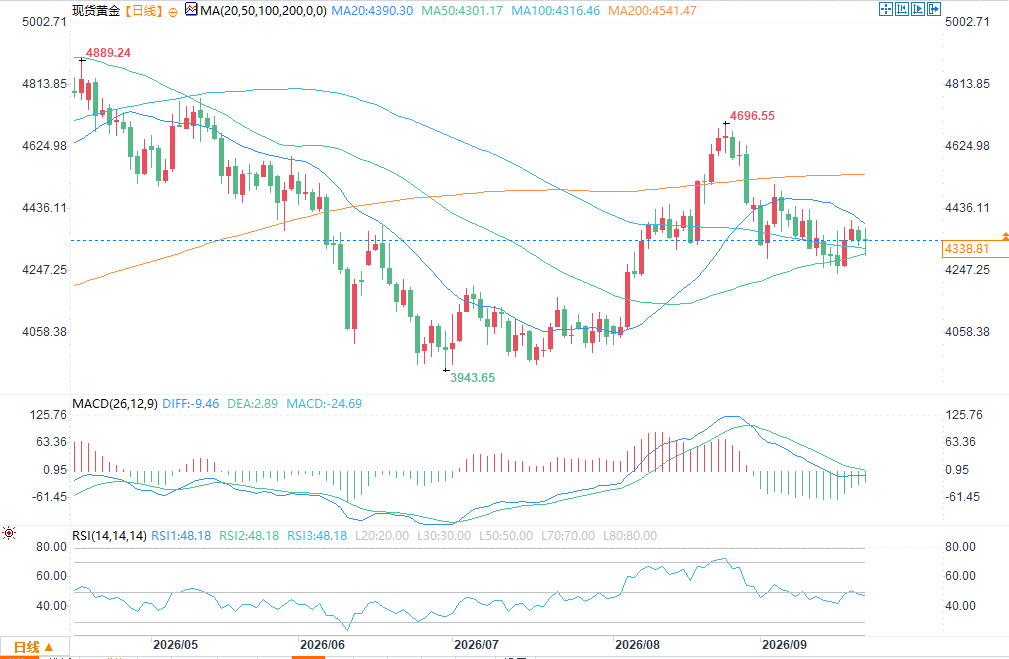 (Spot Gold Daily Chart Source: FX678) On the daily chart, spot gold held above the 50-day and 100-day Simple Moving Averages (SMAs), located at $4301 and $4316 respectively, but the price remains below the 200-day SMA at $4541. This technical pattern suggests a neutral short-term bias for gold, with the price caught between short-term trend support and long-term resistance. Momentum indicators also indicate a range-bound market: the Relative Strength Index (RSI) is at 47, close to the neutral level of 50; the Moving Average Convergence Divergence (MACD) remains in negative territory, although the red histogram bars are narrowing, suggesting weakening bearish momentum. On the downside, the 100-day moving average at $4316 and the 50-day moving average at $4301 form a key support zone. A break below this zone could see the price fall to $4150, or even test the psychological level of $4000. On the upside, the 200-day moving average at $4,541 is the first resistance level, followed by the $4,700 mark. Only a sustained break above these two levels will further confirm the bullish outlook.
Earlier on Tuesday, a report citing a senior Iranian official stated that Iran proposed reopening the Strait of Hormuz within seven days if the United States lifted its blockade of Iranian ports and eased military pressure. This proposal was reportedly conveyed to Washington through mediators. This news caused the dollar to give back some of its earlier gains, helping gold prices recover some losses; meanwhile, crude oil prices continued their decline, recording their fifth consecutive day of losses. However, as the market interpreted Trump's remarks, both the dollar and crude oil rebounded to some extent. Trump stated that the United States hopes to reach an agreement with Iran after the midterm elections on November 3. The dollar index traded around 100.60, slightly below the intraday high of 100.69, the highest level since July 30. Meanwhile, West Texas Intermediate (WTI) crude oil prices approached $90, down about 1.31%. For gold, the main bearish factor remains the hawkish policy stance of the Federal Reserve. Unless the Strait of Hormuz reopens, significantly lowering oil prices and easing inflation concerns, gold prices are unlikely to see a strong rebound. Gold itself does not generate interest income, and rising borrowing costs often suppress gold prices. Last week, the Federal Reserve raised the federal funds rate by 25 basis points, bringing the rate range to 3.75%–4.00%, as policymakers addressed stubborn inflation and persistently high energy prices. Of the 18 Fed officials, 16 expect at least one more rate hike this year. ING analysts noted, “Gold prices weakened slightly at the beginning of the week as investors assessed the impact of the Fed’s first rate hike since 2023 and the possibility of further tightening of monetary policy.” Analysts mentioned that public statements by Fed officials “further reinforced concerns about persistently high inflation,” thus “supporting market expectations that interest rates will remain high for a longer period.” ING acknowledges that “tightening monetary policy remains a headwind for gold,” but also points out that gold ETF holdings are at a six-month high, and continued gold purchases by central banks will buffer the downside potential of gold prices. Technical Analysis: Spot gold has stabilized above the 50-day and 100-day simple moving averages. (Spot Gold Daily Chart Source: FX678) On the daily chart, spot gold held above the 50-day and 100-day Simple Moving Averages (SMAs), located at $4301 and $4316 respectively, but the price remains below the 200-day SMA at $4541. This technical pattern suggests a neutral short-term bias for gold, with the price caught between short-term trend support and long-term resistance. Momentum indicators also indicate a range-bound market: the Relative Strength Index (RSI) is at 47, close to the neutral level of 50; the Moving Average Convergence Divergence (MACD) remains in negative territory, although the red histogram bars are narrowing, suggesting weakening bearish momentum. On the downside, the 100-day moving average at $4316 and the 50-day moving average at $4301 form a key support zone. A break below this zone could see the price fall to $4150, or even test the psychological level of $4000. On the upside, the 200-day moving average at $4,541 is the first resistance level, followed by the $4,700 mark. Only a sustained break above these two levels will further confirm the bullish outlook.
- Risk Warning and Disclaimer
- The market involves risk, and trading may not be suitable for all investors. This article is for reference only and does not constitute personal investment advice, nor does it take into account certain users’ specific investment objectives, financial situation, or other needs. Any investment decisions made based on this information are at your own risk.